
Many CPG manufacturers invest in Nielsen and IRI data to create category assessments for individual retailers. These analyses are one component of the category management process.
The most compelling and accurate category assessments compare individual retailers against their competitors. And the best benchmark for this comparison is the Nielsen or IRI “remaining market.” The remaining market aggregates all competitor stores for a particular retailer into a single comparison point.
Background and Lingo
Both Nielsen and IRI construct retail geographies in consultation with individual retailers. Nielsen calls these geographic areas Trading Areas (TAs). IRI calls them Retailer Marketing Areas (RMAs). For each retailer, IRI and Nielsen can then identify all competitive stores physically located within the boundaries of that retailer’s RMA/TA.
The competitive market provided by Nielsen is called the ROM (short for “Rest of Market”) and includes just the competitors. IRI provides the CRMA (short for “Competitive Retailer Market Area”) which is the combination of the retailer plus competitors.
When you purchase an ongoing subscription to Nielsen or IRI retailer markets, it’s standard to receive each retailer’s ROM/CRMA. So your subscription typically includes two markets for each account you purchase: 1) the retailer’s own stores and 2) the retailer’s ROM/CRMA.
If you are ordering one-time reports via Excel, you can still obtain the ROM/CRMA data. But you need to request the ROM/CRMA as an additional market, and it will likely add to the cost.
You might be tempted to skip the ROM/CRMA and, instead, benchmark using data for individual competitors. However, there are multiple problems with this approach:
- Nielsen and IRI contracts forbid you from showing one retailer’s data to another retailer!
- Not all individual retailers are available from IRI/Nielsen.
- Buying data for multiple competitors can get pricey.
- Each retailer’s trading area is likely a little different, so you won’t be comparing precisely the same geography.
That’s why using the ROM/CRMA is a much better method in most cases.
ROM vs. CRMA: Which Is Better?
As mentioned above, Nielsen provides the ROM, which is just the competitive retailers. By contrast, IRI provides the CRMA which includes both the retailer and its competitors. If you have IRI data, you will need to subtract the RMA from the CRMA to get the ROM.
Analytically, I prefer the ROM as the benchmark. It’s a cleaner comparison. In addition, if a retailer has a large share of it’s trading area, the retailer data will have a big impact on the values for the CRMA. So I think it’s worth it to calculate the ROM if you have IRI data. However, that’s not always possible or it may be too much work. And it won’t make a huge difference if the retailer is a small share of the market. In the analysis below, I’ve used the ROM but you can substitute the CRMA. Just keep in mind the extent to which your retailer’s performance is driving the CRMA results.
How Benchmarking Helps Your Analysis
Once you have data for both the retailer and the ROM, what types of comparisons should you make? Category growth, mix of brands and sizes sold, and regular and promoted price points are all great places to start.
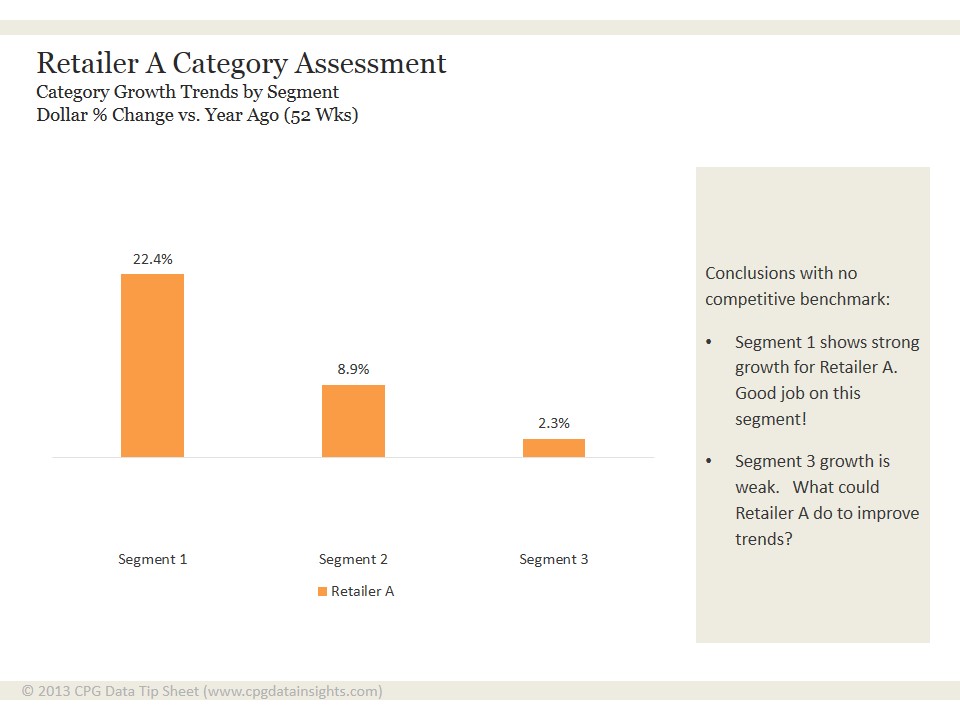
Adding the context of the ROM helps you more accurate identify opportunities. To illustrate, the example below compares dollar growth by segment for a retailer versus the ROM.
The first chart shows growth rates just for the account, with no comparative data. Based on the chart, you might conclude that the retailer has maxed out Segment 1, while opportunities remain in Segment 3.
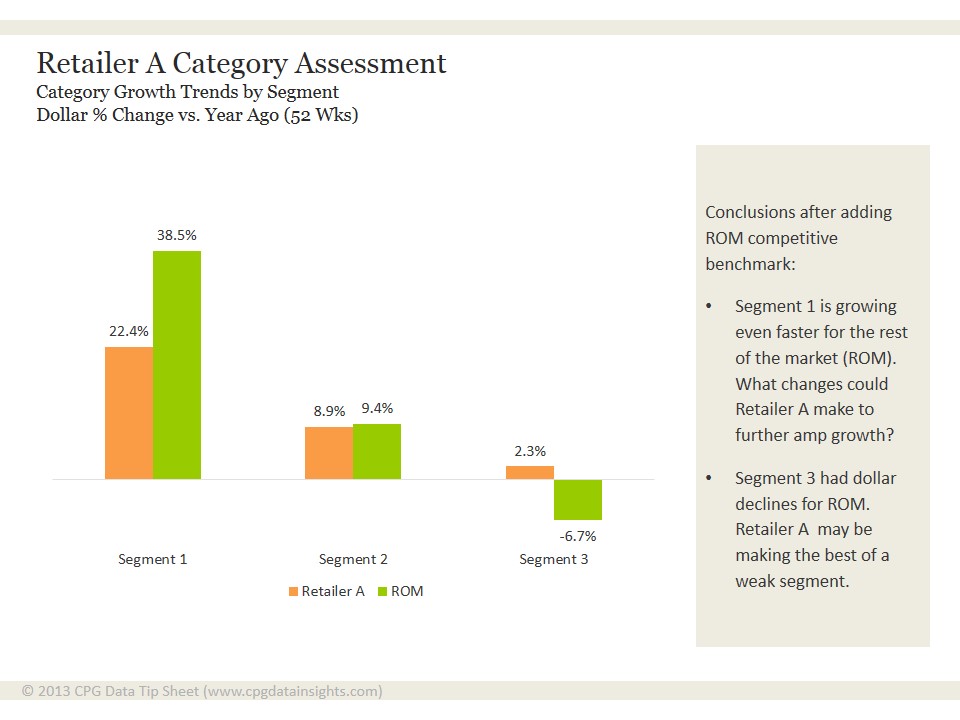
But when you include the ROM data, comparing the retailer to competitors in the same geography, you can see that there are still opportunities for growth in Segment 1, while Segment 3 looks like it’s doing well in a weak market.
 Benchmarking retailer performance versus competitors is a key part of any category assessment. Need help getting started with your category assessments? Contact us to discuss how our consulting services can help you overcome this or any other Nielsen/IRI challenges you’re facing.
Did you find this article useful? Subscribe to CPG Data Tip Sheet to get future posts delivered to your email in-box. We publish articles twice a month. We will not share your email address with anyone.
Dear Sally,
I just read this post and have following queries-
As you described individual retailer growth in first chart across 3 segments and its comparison with ROM. Is that only above described charts are sufficient for that analysis or any other data or parameters are required to complete the competitive benchmarks in category assessment? I would appreciate if you could provide details.
Secondly, in the second graph you described segment 1 is growing faster 22.5% than ROM which is 38.5%. Can you please explain the on what basis?
I would be thankful to you for your explanation.
Kind regards,
Meeta
Hi Meeta,
Dollars is usually the most important measure for retailers. So comparing dollar growth is likely to provide the most compelling/relevant information. However, it’s possible that looking at other sales measures like units or equivalized volume would be helpful or enrich the analysis.
Of course, growth is not the only thing you would look at in a category assessment. You would examine many other elements of the business to provide a complete performance picture: shares, distribution, pricing, brands carried, etc. Providing you with further details on how to do that is beyond the scope of this article but may be something we post about in the future.
Regarding the second graph, the ROM is growing faster for segment 1. Without looking at the ROM, the 22.5% growth for Retailer A looks good but it’s not so impressive when you add in the comparison to the ROM. This comparison provides a good starting point for looking more closely at whether there is more Retailer A could be doing to grow this segment.
Thank you very much Sally for your explanation. It sounds perfect if, someone can look only the retailer without ROM.
As a former Nielsen employee, I can tell you that Nielsen also offers “Market”, which is Retailer + ROM.
Sally,
You might also consider market share change in your assessment, did the -16 pts of growth change cost anything in market share?
Thanks for your comment, Dan. It’s always good to consider share as well as absolute growth. Both are important metrics.
Hello,
My company does not get ROM numbers. How would I complete this calculation?
For example: I pulled retailer specific data. I also pulled market data(and calculated $VOL YA. Not sure where to go from here.
Simon
Depends on what you mean by “market data”. If you are saying you get retailer+ROM (the total trading area) then you can subtract retailer from retailer+ROM to get ROM. If you are saying you get a broader market measure like a metro area (Boston) or a census region (New England), then you cannot estimate ROM. What you can do instead is compare the retailer to the best available benchmark and hopefully draw some conclusions. When thinking about that comparison, ask yourself: how much overlap is there between retailer and my benchmark? In other words, are the retailer results driving the benchmark results in a significant way?