I want to wholeheartedly thank Robin and Sally for trusting me as the new steward of the incredible CPG Data Tip Sheet. As they mentioned in their post last week, the site truly helped me get up to speed on CPG analytics, fundamentals, and terminology when I started my career at Nielsen over a decade […]
velocity
Tip Sheet Mailbag: Q&A on Velocity
We get a lot of questions from readers. Sometimes our answers touch on things we haven’t fully explored in our articles. We want everyone to benefit from these nuggets of information so decided to post a series of Q&A articles which will highlight some interesting correspondence. Our first post covers three questions on the […]
Using TDP to Enhance Your Analysis, Part 1: Velocity
TDP (a.k.a. Total Distribution Points) is my favorite syndicated data measure. Why? Because distribution is fundamental to any business question. Therefore, it’s a great place to start when looking for answers. And TDP is the broadest, most flexible way to examine this crucial dimension. If you are looking at individual UPCs, you don’t need TDP – […]
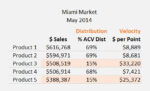
Size of the Prize: How Much Is One More Point of DISTRIBUTION Worth?
In this previous post I explained how to quantify the size of the opportunity for both your brand and the category if you are getting less than your fair share of distribution. This time I will show how to quantify the impact of getting your brand into more stores, regardless of your current share of […]
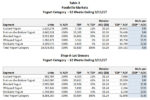
Velocity: How Well Your Product REALLY Sells
Velocity questions have dominated the CPG Data Tip Sheet inbox this month, with a number of readers posting comments or writing with questions about this important measure. So we decided it’s time to turn our attention to what is, after all, the third most important measure in your database. Why is velocity the #3 […]