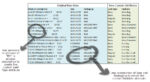
In my previous blog post, I described two ways to customize your Nielsen/IRI product data by renaming and grouping product values. In a continuation of that post, I’ll now describe a third way of customizing your data—by creating new attributes. 3. Create New Attributes We’re all accustomed to creating new measures, like dividing dollars by units […]
products
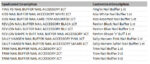
From Syndicated to Custom: Transform Your Nielsen/IRI Product Data – Part 1
The “syndicatedness” of IRI/Nielsen data is one thing that makes it so powerful. Think about it: IRI and Nielsen capture, label and organize millions of product transactions across hundreds of retailers and then distribute a comprehensive dataset set to thousands of businesses. As a result, everyone can start with the same data, making it easier […]
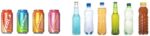
Product Attributes: The Key to Meaningful Analysis
A product’s attributes are what makes it distinct from other products. Attributes include things like size, color, flavor, package type and other features that are relevant to the category. From a consumer perspective, these attributes are what determine the consideration set and influence the ultimate purchase decision. From a retail perspective, product attributes help define […]
How to Define Your Product Category (And Why It Might Be Harder Than You Think)
If you define your product category well, you lay the foundation for successful analysis. If you don’t, your analysis can be misleading or useless. Hmm, which is worse? Misleading or useless? What is the “right” way to define a category? Seems like a simple question but, for some products, there’s not a simple answer. Here are […]
The 4 Key Dimensions In Every Nielsen/IRI Database
Does it seem nerdy to worry about data structure when your goal is business insight? It’s not (I promise). Understanding the nitty gritty of your IRI or Nielsen data will ensure you buy the right information and interpret it correctly. The 4 Dimensions are the grammar of the scanner data language. They impact the price […]