
Wow – we are now more than a year into the COVID-19 pandemic, which has impacted virtually all aspects of life and business. And analysis. Around this time in 2020 I wrote this post which talks about important things to consider while doing analysis during uncertain, volatile times. During several weeks in March-April, 2020, sales […]
covid-19

More On Panel Data + Shopping Behavior During the COVID-19 Pandemic
Recently, I wrote about a Nielsen chart illustrating consumer behavior in the U.S. during the COVID-19 pandemic. In this post, I’ll show these same metrics from another panel provider: Numerator. Numerator (formerly known as InfoScout) gathers their panel data by having panelists take photos of physical receipts and provide access to their e-receipts. That’s a […]
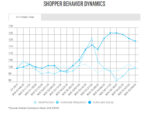
A Panel Data Case Study: Shopper Behavior During COVID-19
As I shared recently, there is a wealth of free, public information coming out from data providers on consumer behavior during these crazy times. In this post, I’ll highlight, explain, and critique a chart published by Nielsen. Next week, I’ll share a similar chart from Numerator. Taking it back a step, what is panel data? […]

Analysis Tips During Very Uncertain Times
In these uncertain times, you’re probably asking (or being asked) questions like: What will the business look like for the rest of the year? Will it get back to normal and, if so, when? Will there be a “new normal” and what will that look like? Of course, there is no one right answer to […]