
• Skip to primary navigation
  • Skip to main content
  • Skip to primary sidebar
  • Skip to footer

CPG Data Tip Sheet

Transforming your syndicated data into business insight

  • Home
  • Glossary
  • About
  • Contact Us
  • Subscribe
Blog » How To Understand Your Database

How To Understand Your Database

The Product Mix Trap: Why Averages Can Lie in CPG

June 16, 2026 By Kevin Lehmann 1 Comment

Print Friendly, PDF & Email

I want to wholeheartedly thank Robin and Sally for trusting me as the new steward of the incredible CPG Data Tip Sheet. As they mentioned in their post last week, the site truly helped me get up to speed on CPG analytics, fundamentals, and terminology when I started my career at Nielsen over a decade […]
Filed Under: How To Communicate Insights, How To Understand Your Database Tagged With: CPG data, distribution, POS data, product mix, velocity

From Syndicated to Custom: Transform Your Nielsen/IRI Product Data – Part 2

February 20, 2019 By Sally Martin 2 Comments

Print Friendly, PDF & Email

In my previous blog post, I described two ways to customize your Nielsen/IRI product data by renaming and grouping product values. In a continuation of that post, I’ll now describe a third way of customizing your data—by creating new attributes. 3. Create New Attributes We’re all accustomed to creating new measures, like dividing dollars by units […]

Filed Under: How To Understand Your Database Tagged With: attributes, characteristics, products

From Syndicated to Custom: Transform Your Nielsen/IRI Product Data – Part 1

January 23, 2019 By Sally Martin 1 Comment

Print Friendly, PDF & Email

The “syndicatedness” of IRI/Nielsen data is one thing that makes it so powerful. Think about it: IRI and Nielsen capture, label and organize millions of product transactions across hundreds of retailers and then distribute a comprehensive dataset set to thousands of businesses. As a result, everyone can start with the same data, making it easier […]

Filed Under: How To Understand Your Database Tagged With: attributes, characteristics, products

The Gold Standard

New Age Panels: The Next Gold Standard for Shopper Data?

August 1, 2018 By Guest 6 Comments

Print Friendly, PDF & Email

We are delighted to share this guest post from panel data guru Paul Hunter. Paul is the Markley Visiting Professor at Miami University (Oxford, Ohio) where he teaches courses in marketing. In addition, he is the principal of Oxford Analytics consultancy. Paul also serves as a board member of Market Research Institute International (MRII). Previously, […]

Filed Under: How To Understand Your Database Tagged With: panel data

CPG Syndicated Data Markets: Part 2 – The Nitty-Gritty

May 29, 2018 By Sally Martin 20 Comments

Print Friendly, PDF & Email

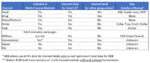
  Markets are one of the four dimensions that are fundamental to CPG data. I’ve written a two-part series to cover all aspects of the topic. Who should read this post (Part 2)? Anyone interested in the details about how Nielsen/IRI/SPINS cover the following brick & mortar channels: Grocery/Food Mass Merchandise/Walmart Drug Dollar Club Military […]

Filed Under: How To Understand Your Database Tagged With: channels, markets

Product Attributes: The Key to Meaningful Analysis

March 17, 2014 By Robin Simon 6 Comments

Print Friendly, PDF & Email

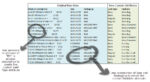
A product’s attributes are what makes it distinct from other products.  Attributes include things like size, color, flavor, package type and other features that are relevant to the category.   From a consumer perspective, these attributes are what determine the consideration set and influence the ultimate purchase decision.   From a retail perspective, product attributes help define […]

Filed Under: How To Understand Your Database Tagged With: attributes, characteristics, products

  • Page 1
  • Page 2
  • Page 3
  • Go to Next Page »

Primary Sidebar

Top Posts

  • The 2nd Most Important Measure: % ACV Distribution
  • Velocity: How Well Your Product REALLY Sells
  • Total Distribution Points: Master of All Distribution Measures
  • xAOC and MULO: Multi-Channel Markets in Nielsen & IRI
  • The Beginner’s Guide to Trade Merchandising Measurement

Search CPG Data Tip Sheet

About CPG Data Tip Sheet

The CPG Data Tip Sheet is published by Kevin Lehmann and Goods Group. It was founded in 2012 by Sally Martin and Robin Simon, two consultants who met in business school over a shared interest in the geeky side of marketing and went on to build independent practices of their own. Over more than a decade they turned hard-won experience into plain-English explanations of how CPG data actually works and how to analyze it.

Robin and Sally built this into something the CPG and consumer industry trusts. It continues in that spirit.

Categories

  • Glossary (80)
  • How To Answer Business Questions (43)
  • How To Communicate Insights (19)
  • How To Get Started with Nielsen/IRI (22)
  • How To Understand Your Database (13)
  • Know Your Measures: Distribution (25)
  • Know Your Measures: Pricing and Promotion (45)
  • Know Your Measures: Sales (21)
  • Miscellaneous (6)
  • Uncategorized (1)

Tags

ACV analysis examples analytic skills attributes average items base base weighted weeks career development category management channels characteristics coronavirus coverage factor covid-19 Database distribution due-to Excel tips Facts incremental markets Measures merchandising new items panel data periods pricing pricing strategy products promoted price quantify opportunity retailer direct data retailer markets shopper data store data Syndicated TDP the basics trade promotion trading areas velocity visualization visualizations volume bridge volume decomposition

Footer

Categories

  • Glossary (80)
  • How To Answer Business Questions (43)
  • How To Communicate Insights (19)
  • How To Get Started with Nielsen/IRI (22)
  • How To Understand Your Database (13)
  • Know Your Measures: Distribution (25)
  • Know Your Measures: Pricing and Promotion (45)
  • Know Your Measures: Sales (21)
  • Miscellaneous (6)
  • Uncategorized (1)

Search CPG Data Tip Sheet

Tags

ACV analysis examples analytic skills attributes average items base base weighted weeks career development category management channels characteristics coronavirus coverage factor covid-19 Database distribution due-to Excel tips Facts incremental markets Measures merchandising new items panel data periods pricing pricing strategy products promoted price quantify opportunity retailer direct data retailer markets shopper data store data Syndicated TDP the basics trade promotion trading areas velocity visualization visualizations volume bridge volume decomposition

Terms of Use | Copyright © 2026 CPG Data Insights · Log in