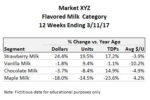
In a recent post, I illustrated the most common usage of Total Points of Distribution (TDP) – as a substitute for % ACV in velocity calculations. In this post, I’ll share another one of my favorite ways to leverage the TDP data metric, which is explaining sales trends. If you aren’t familiar with TDP, read […]
analysis examples
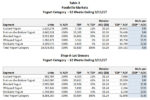
Using TDP to Enhance Your Analysis, Part 1: Velocity
TDP (a.k.a. Total Distribution Points) is my favorite syndicated data measure. Why? Because distribution is fundamental to any business question. Therefore, it’s a great place to start when looking for answers. And TDP is the broadest, most flexible way to examine this crucial dimension. If you are looking at individual UPCs, you don’t need TDP – […]
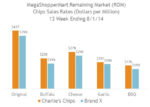
How to Build an Argument for Increased Retail Distribution
Over the last year, we’ve written lots of articles showing you how to use key IRI/Nielsen measures. In this post, I’ll pull together several of those lessons in a step-by-step mini case study. The goal of this analysis is a common one: convince a retailer to increase the number of varieties for our target […]