
“There are a lot of questions about inflation and how it impacts the business. We would love to hear your thoughts on how we can analyze this topic!”
– Actual reader comment on CPG Data Tip Sheet, 3/22/22
Well, here are some thoughts for you!
Background and Context
Let’s start with some basic information: what exactly is inflation and how bad is it right now (March 2022)?
As explained in more detail in this article from the International Monetary Fund, inflation is the rate of increase in prices over a given period of time. It’s typically a broad measure, like the overall increase in prices or the increase in the cost of living in a country. But it can also be more narrowly calculated—for certain goods, such as food, or for services, such as a haircut, for example. Whatever the context, inflation represents how much more expensive the relevant set of goods and/or services has become over a certain period, most commonly a year. As the cost of living rises some households are more affected than others, depending on their income and financial status. Cost of living depends on the prices of many goods and services and the share of each in the household budget. To measure the average consumer’s cost of living, government agencies conduct household surveys to identify a basket of commonly purchased items and track over time the cost of purchasing this basket. The cost of this basket at a given time expressed relative to a base year is the consumer price index (CPI), and the percentage change in the CPI over a certain period is consumer price inflation, the most widely used measure of inflation. The Fed and most economists think annual inflation of around 2% is the sweet spot for prices. They would rather have a little bit of inflation rather than risk getting into deflation which is very detrimental to the economy.
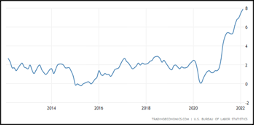
Here’s why everybody is now very concerned about inflation. In March 2021 inflation was at 2.6%, then 4.2% in April 2021 and almost 8% in February 2022 – a more than 3-fold increase in one year! (Get current and projected inflation rates here from tradingeconomics.com, based on data from the U.S. Bureau of Labor Statistics. That’s where these charts come from.)
Annual Inflation Rate by Month, U.S. – Most Recent 12 Months
Now let’s put this in context over time, looking back 10 and then 25 years. Yes, in February 2022 we are seeing the highest inflation rates in many people’s working lives (since January 1982)!
Annual Inflation Rate by Month, U.S.
10 Year History
25 Year History
Things to Think About When Conducting Analysis During Periods of High Inflation
- Don’t just look at dollar sales! EQ and unit sales tell you how much actual product is being purchased. When there is inflation, dollar sales could be increasing due to higher prices but how does that translate into how much product shoppers are buying? Read this post to see why it’s important to look beyond dollar sales. During periods of high inflation, you may see dramatically different growth rates when comparing dollars to volume. Looking at dollars may give you the impression that sales are growing well but (surprise!), you may find your volume is declining.
- Inflation is calculated using a standard “basket of goods” – housing, transportation (including gas), food, etc. Make sure to see what the “inflation rate” is for your category/product. It could be higher, lower or similar to the general inflation numbers that you hear reported.
- Think about your category/product and what/where consumers might find substitutes as prices rise. How are prices moving for those substitutes? If prices are rising at a similar rate for all substitutes, the impact of a price change for your product is likely to be lower.
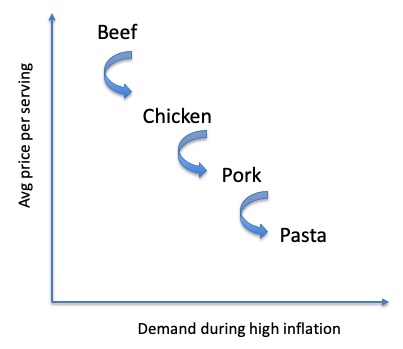
- Where are you in the value equation for your product and its substitutes? Even If it’s a product where overall demand is pretty fixed (like many household cleaning and paper products), you might still see consumers trading down the value chain in response to pricing pressures. Demand for premium products (food and beverage, some personal care) tended to be up during COVID as people treated themselves to “at-home luxuries” they did not previously buy. It is possible that sales for those types of products/brands might go the other way now with value product demand rising. An example of consumers trading down during inflationary times has been seen across foods used as “center-of-the-plate” for lunch and dinner. Beef is likely to lose the most sales while Pasta is likely to benefit when prices are rising.
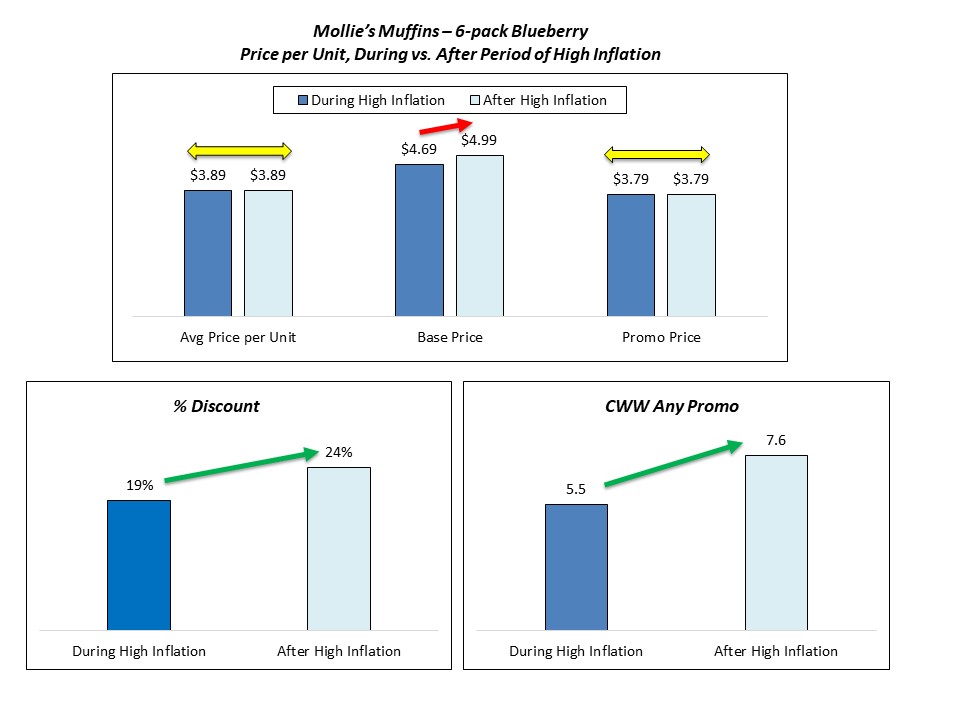
- Remember that inflationary expectations are temporary – inflation doesn’t increase forever! Although regular/non-promoted prices are unlikely to come down (they rarely do), we are more likely to see deeper discounts and/or more frequent promotions when the inflation rate comes down again. In this example for the PPG Mollie’s Muffins 6-pack Blueberry, note how average price stays the same even though base price is higher than it was before. This is achieved by maintaining the promoted price (resulting in a deeper discount) and having more frequent promotions.
- In 2022, with continuing impacts from the COVID pandemic plus a war in Europe, there are many strong forces, in addition to inflation, that are impacting CPG product demand. It’s going to be tough to isolate the impact of inflation by conducting an ad hoc analysis just using what’s available in your regular database. A more sophisticated modelling effort is much more likely to do a better job of factoring out the impact of price, trade promotions, distribution, advertising, inflation and other business drivers. In addition, there are still supply chain/availability issues for some products and demand is shifting as Covid behaviors slowly move back to normal. Models should also include variables that account for any gaps in product availability. For changes due to Covid behaviors, it’s best to model at the market level, as restrictions and behaviors are so dependent on local guidelines and rules.
- Take a look at your category/product period by period (I would start with 4-week data) for 2021 to identify insights about 2022, especially towards the end of 2021 – you will probably see a combination of inflationary pressure on prices and also easing of demand for CPG products at retail as demand is slowly shifting back to out-of-home consumption and usage. Both factors are going to be putting some pressure on units and both were ramping up as the year went along (and the same trends are continuing into 2022 from what we’ve seen). Looking at those period by period trends might generate some hypotheses/insights for your specific product.
Do you have any tips to share for how to account for inflation or analyze its impact on your business? Let us know in the comments below. Subscribe to CPG Data Tip Sheet to get future posts delivered to your email in-box. We publish articles on an ad hoc basis (less than once a month). We will not share your email address with anyone.
Leave a Reply