
![]()
This is the second in a series of posts that show how you can use your IRI or Nielsen POS database to conduct an annual analysis of all the new products introduced in your category. In this previous post I showed a way to identify the new items in a category, based on distribution.
Once you know what the new items are, these are some of the most common things you’ll want to know about them and can find out from your database:
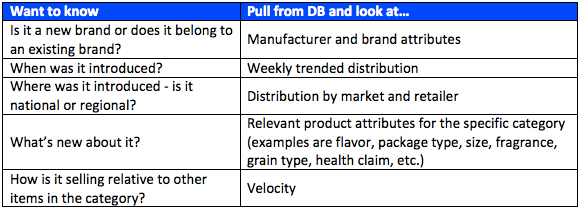
New Brand or Line Extension?
You will of course be familiar with the leading players in your category so tracking all new UPCs is a good way to find out about other smaller (often regional) brands. By looking at Manufacturer (in addition to Brand) you may be surprised to find that a small, emerging brand could be owned by a much larger company. Several natural/organic brands are in fact owned by Kellogg’s and General Mills, for example.
When Was It Introduced?
Looking at weekly trended distribution allows you to see two important things: when a product started appearing in-market and how fast (or slow) it is taking to ramp up and reach its on-going sales level. Distribution of some new items plateaus in a few weeks while others may take several months. Most new items from the same manufacturer reach their ultimate distribution level in about the same number of weeks and that timeframe is typically related to the goals that the salesforce has.
For some categories there may be too many new UPCs to do this for. If that’s the case, you may want to focus on the ones with the highest year-end distribution and/or sales. Keep in mind that many categories tend to have one or two general times of year when new items are introduced. These periods are usually related to when the retailers are resetting the aisle or section for those categories.
Where was it introduced?
If a new item has relatively low distribution it could be that it is only in a certain part of the country. When you look at distribution by market, you may see that a new item is only in the Northeast or only in the South. This is more common for regional brands (and also private label items for regional retailers). For national brands, you may see that only certain retailers have taken the new item. Sometimes Walmart (or another retailer) will carry something before anybody else does. When that happens, the other retailers will wait to see how the new item performs before agreeing to authorize it.
What’s new about it?
All products have a size, so that can be new regardless of category. Do the new items tend to be larger or smaller than existing items? In this day and age of increasing cost pressures for manufacturers, it is somewhat common for a new item to be exactly the same as an existing one but in a slightly smaller size (for example 15 instead of 16 ounces or 10 instead of 12 packets). Flavor is often what’s new about a food or beverage item, while Fragrance is commonly new for personal care or household cleaning products. Grain type has been a hot area of innovation for many starch-based foods (quinoa, anyone?) while Gluten Free has also been popular in the new products arena. The database attribute “Type” or “Segment” differs by category. The Greek segment in yogurt has seen explosive growth while the Concentrated segment has been a bright spot for new detergents.
How well is it selling?
Sales measures (dollars, units, volume) will tell you how much of the new item is sold, but how does that compare with other items in the category? In order to have a fair comparison you need to look at velocity. This allows you to compare sales of items with different levels of distribution. This is especially important for new items, since they may still be building distribution. For items that were not introduced at the beginning of the year make sure to do a velocity comparison for a time period when the new items were available for purchase. Keep in mind that retailers often look at velocity rankings to determine which items to keep or delete from their shelves.
In a future post I’ll show some data and how you can summarize what is happening with innovation in a category.
Subscribe to CPG Data Tip Sheet to get future posts delivered to your email in-box. We publish articles every few weeks. We will not share your email address with anyone.
Hi Robin,
Great article. We’ve worked a lot in this area and add a number of other elements. One which is also interesting is the discontinuation of an SKU. Often a new SKU comes in to replace an old one. It may be a simple change, but is a new line item in the report. When we analyze the new products, we want to make sure it is truly new and want to understand the issues concerning the combination of the discontinuation and new availability.