

This is the first in a series of posts on how to quantify the impact of improving the various elements of purchase behavior among consumers. Some posts will focus on increasing sales for a manufacturer (probably more useful if you are in Marketing) and others will focus on increasing sales for a retailer (more useful if you are in Sales). Although some data vendors include reports that have some explicit measures to help you quantify the impact of increasing the various panel measures, sometimes you may just have the current values and need to do this yourself. That’s where this post (and others to follow) come in.
This is all based on household panel/shopper data (not POS/store data) and can come from a data vendor or directly from a retailer. Take a look at these posts if you need a refresher on this type of data:
- Overview of panel/shopper data
- The 4 basic panel/shopper measures
- Using panel/shopper data to understand what is driving the business
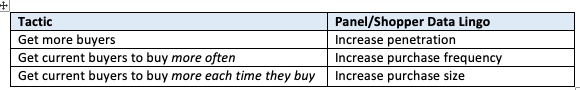
The chart below shows the 3 ways to increase sales of a specific brand:
For this example, we’ll focus on one brand at the annual, national (Total US All Outlets) level for all the Marketing folks out there. Here’s the panel/shopper data we’ll use:
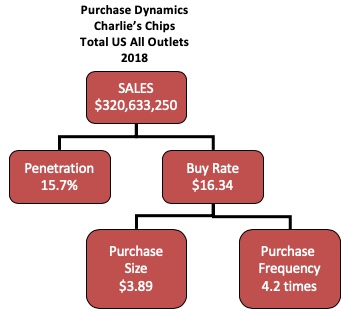
As a reminder, penetration (also called HH Buying) is the percentage of households that have purchased the brand. It ranges between 0 (nobody bought) and 100% (everybody bought). Note the penetration is usually expressed as a % of households, not individual people. In our example, 15.7% of households across the Total US bought Charlie’s Chips at least one time during 2018 and annual sales of the brand were over $320 million.
Sample business question: The Charlie’s Chips team is planning to bring out a new flavor that they believe will attract new buyers to the brand. (Other ways that you can attract new buyers are through more/better advertising, more frequent/effective consumer promotions or trade promotions. Keep in mind that some marketing tactics are used to get new buyers while others are used to get your current buyers to buy more.) How much more would we sell if we increase penetration from 15.7% to 17%? In panel/shopper data lingo this translates into calculating how much a point of penetration is worth and then multiplying that by how many points the penetration is expected to increase.
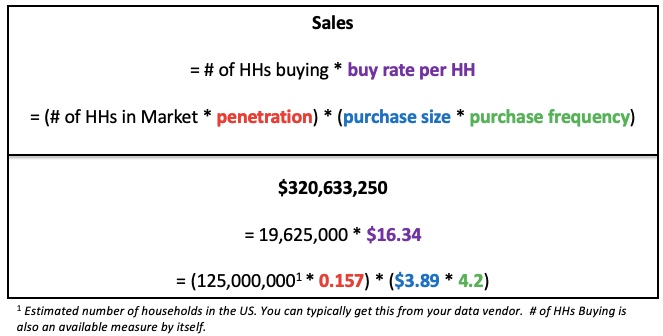
In order to answer the business question, you need to understand the mathematical relationship between the different measures which is illustrated below.
How much a point of penetration is worth:
- “1 point of penetration” is 1% of the 125 million total US households, so 1,250,000 households (=0.01 * 1,250,000). Note that this is true for ALL products! One point of penetration of all US households is always 1,250,000 households, regardless of product.
- A point of penetration for Charlie’s Chips in the Total US for a year is worth $20,422,500 (=1,250,000 * $16.34).
How much increasing from 15.7% to 17.0% is worth:
- This is an increase of 1.3 points (= 17.0 – 15.7).
- We assume that any new buyers will have the same buy rate as existing buyers, which is $16.34.
- So the additional sales from increasing penetration to 17.0% is $26,549,250 (= 1.3 * $20,422,500).
Going through this exercise is a great way to sensitivity test your marketing tactics and assumptions.
Click here to download an XLS file that allows you to quickly calculate the impact of changes to the 3 key panel/shopper measures.
Did you find this article useful? Subscribe to CPG Data Tip Sheet to get future posts delivered to your email in-box. We publish articles about once a month. We will not share your email address with anyone.
Great post! I always find it helpful to decompose some of these metrics to see what levers you can push on to improve sales.
I often see analysis where they show the value of improving penetration, distribution, etc by X points. I almost never see rationale, though, for why they chose X. It’s usually something arbitrary, i.e., “if we improve household penetration by just 1 percentage point, we’ll pick up $5 million in sales!”
But it’s really hard to pick up that extra point of penetration without doing anything to earn it. To get there, I feel that something about the product needs to change (along the lines of the 4 Ps of marketing).
Using primary research or historic data, we can assess how consumers might react to such a change, then we can apply that to the various factors to tell us the size of the prize might change.
You’re right that people often choose an arbitrary goal for improving penetration (or whatever else). The goal should be related to a. what your current penetration is and b. what it is likely to cost (in $ and effort) to get that many more buyers.
Thanks for sharing this insightful post.
I’m curious to know how one can approach a “due to” or decomposition analysis of volume using panel metrics. Specifically, if we’re looking to understand the change from Vol YA to Vol TY, with drivers such as penetration / number of buyers, buy rate, purchase frequency, and purchase size—
is there a mathematical framework or model that breaks this down and helps quantify the contribution of each lever?
Would love to hear your thoughts or see examples if available.
Thanks for the question that inspired me to write this post in response.