Has this happened to you? Sales of your brand are down vs. the same period last year and management wants to know why. Sales is saying it’s because there is less advertising this year but Marketing is saying it’s because you’ve lost distribution and the retail price and merchandising are not as competitive. Another, more pleasant, scenario is that sales are up and Marketing says it’s because of the addition of more advertising this year but Sales says it’s coming from distribution gains and lower pricing. How do you know what the real answer is?
Since there are many different business drivers that impact sales, the challenge is to estimate how much of the volume change was due to any number of things that were taking place at the same time. In fact, it is often things that are happening in the store at the point of purchase that have the biggest and most immediate impact on sales. Fortunately, your Circana/NIQ (formerly IRI/Nielsen) database has the data to enable you to look at those retail drivers. By accounting for as many business drivers as possible, you can get to a decent answer to the question of why sales are up or down. This post is the first in a series on decomposing a change in volume into its component business drivers. Future posts will address specific drivers and how to quantify the impact of them on the business.
Due-To Analysis, aka Volume Decomp
An analysis like this is often called a “due-to,” because it tells you how much of the sales change is due to each of the drivers. It is also known as a volume decomp (short for volume decomposition) or volume bridge (since it bridges the volume from one period to another). Many of the largest CPG companies have tools from IRI/Nielsen that do this analysis automatically, but smaller companies may not. Find out if your IRI or Nielsen contract includes a volume decomp tool. If it doesn’t, it’s usually because of budget constraints but the good news is that you can conduct the analyses described in this and future posts to get to a good approximation of what is driving your business.
First up, what do you want to explain? See this post about the 3 ways to measure sales – dollars, units and equivalized volume (EQ). I find it best to use a due-to explain the change in physical volume and not dollar sales. That way you can show how much a change in pricing affected the physical volume. You may want to look at the overall dollar impact as well but, for most manufacturers, there are serious operational and cost implications to changes in volume so it’s important to understand and anticipate changes in volume. If your brand is comprised of multiple sizes, then EQ volume is the best measure to use for this. And you can also do this analysis for the category or your competition.
Business Drivers and Elasticity
You can think of the business drivers in a due-to as falling into a few different buckets and you have the data needed to address the first 4 buckets right in your Circana/NIQ database:
- Distribution
- Pricing
- Merchandising
- Competition
- All Other
Everything else not available in your Circana/NIQ database that drives the business falls into All Other. This bucket can have some combination of advertising, consumer promotion, shopper marketing, overall economic conditions, weather and anything else not already mentioned. You may be able to include some of the All Other drivers in your analysis, if the data is easily available at the right levels of geography and time.
In addition to having data for the drivers, you need an elasticity for each driver. Think of an elasticity as how much a change in the driver results in a change in volume. If the elasticity is 1.0, then a 5% increase in the driver results in a 5% increase in volume. If the elasticity is 0.8, then a 5% increase in the driver results in a 4% increase in volume (0.8 * 5%). If the elasticity is 1.2, then a 5% increase in the driver results in a 6% increase in volume (1.2 * 5%). The elasticity is positive if the driver and volume move together or negative if they move in opposite directions and the sign should make sense in real life. For example, if distribution goes up, volume also goes up so the distribution elasticity will be positive. Price elasticity, on the other hand, is negative because if price goes up we expect volume to go down. Elasticities can be determined in different ways and I won’t go into all the analytics behind calculating an elasticity here. Future posts will talk about where to get or how to estimate the elasticity for each driver.
Due-To Analysis
A due-to starts by looking at changes in volume from one period to another, listing factors that might have driven those changes, and gathering data about how those factors have changed. It can be presented as a table and/or in graphical form.
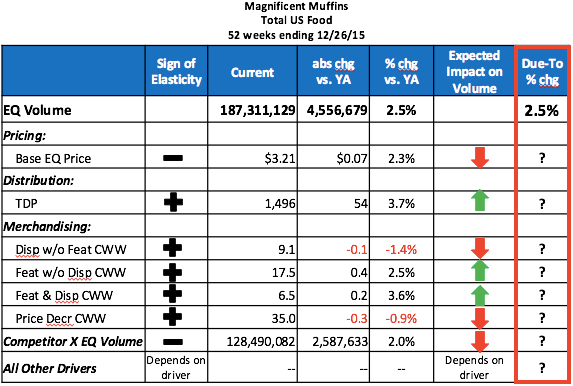
The table below shows that Magnificent Muffin volume is up +2.5% vs. year ago in the Total US Food channel and how much each of the drivers themselves have changed over that same period. With this information compiled, you are ready to work on that last column, the Due-To % chg.

*Due-To % chg = the % change in volume due to that driver. The sum of the Due-To % chg across all drivers = the % chg vs. year ago for volume. The Due-To % chg for All Other Drivers is the difference between the % chg vs. year ago for volume and the sum of all the other due-to % chg values.
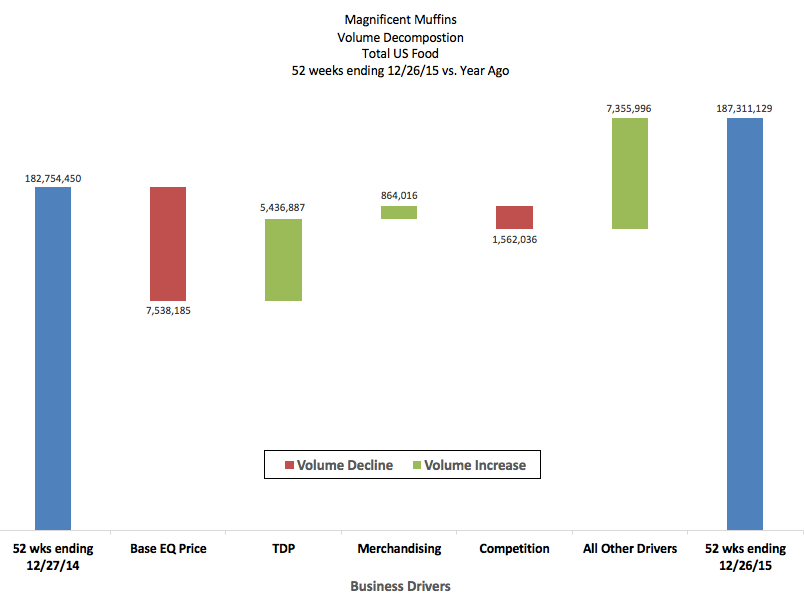
This type of analysis is often presented in a “waterfall” chart that starts with the year ago volume on the far left, then shows the amount of volume change due to each driver and ends with the volume in the current period. Negative volume drivers are in red and positive volume drivers are in green. You can see in this chart that the increase in price and an increase in competitive volume resulted in volume declines, while an increase in distribution and net increase in merchandising across tactics resulted in volume gains for Magnificent Muffins. All Other drivers also contributed to volume gains – this is where more/better advertising, consumer promotion and/or shopper marketing shows up in the due-to.

In these other posts I talk about how to change the ? in the table into due-to % chg numbers and how to quantify the volume impact of each driver, as depicted in the waterfall chart.
Part 2 – Impact of Distribution
Part 3 – Impact of Pricing
Part 4 – Impact of Trade
Part 5 – Impact of Competition
And then the final post in the series, Part 6 – Impact of Everything Else
Did you find this article useful? How do you conduct or present a volume decomp and how is it different than this? Please share in the comments below. Subscribe to CPG Data Tip Sheet to get future posts delivered to your email in-box. We will not share your email address with anyone.

What does CWW stand for? I’ve been using IRI and Nielsen data for over 20 years and have never seen this abbreviation. I’m used to seeing it written as Average Weekly % ACV Feature & Display (or just %ACV F&D implying average weekly).
CWW stands for “cumulative weighted weeks” and is a measure of the amount of merchandising received. It takes into account both reach and frequency of support. The %ACV measures you mention do not take into account the frequency. See this entry in the Glossary on the blog. I’m not sure if it is available on syndicated databases from IRI/Nielsen but I have seen it on custom DBs at many different companies.
Hope that helps!
Hi
I need to create a water fall chart which moves from budget to actual and the movement is because of 5 products of the company. Within the five products there is price and volume variance. Sample data is as below
Budget 1000 Actual 2000
Variance due to Product A (+1800 ) = Price variance (+1500)and Volume variance ( +300)
Variance due to Product B (+200 ) = Price variance (-500)and Volume variance ( +300)
Can i please get the template for the waterfall chart
Pls read the actual as 3000 and not 2000
As always, great and always timely post. Would you happen to have an Excel download of the cool table and/or the waterfall chart that you can share?
Here is a link to the instructions I used to create the waterfall chart:
https://www.ablebits.com/office-addins-blog/2014/07/25/waterfall-chart-in-excel/
The hardest part (which is not hard, just a little tedious) is changing the color of the individual bars and moving the labels with the values above or below each bar.
Hope this helps!
Thanks for this great article. How do you calculate the due-to % chg numbers and how to quantify the volume impact of each driver?
Thanks for asking! The next few posts will be about how to calculate those things. The first one will be posted in the next day or two and is about Distribution. Stay tuned…
Excellent article and I can’t wait for the whole series to be released. Could you elaborate on why you are using Volume and not $ value? Thanks in advance!
Other people have asked the same question about why I used volume and not dollars on the volume decomp, so it’s a popular topic. In order to keep the whole thing somewhat simple, I focused on volume.
A similar analysis can also be done on dollar sales but then you need to explicitly account for 2 different impacts of a price change. Assuming that price has increased, then you need to calculate:
1. how much volume declined because price went up
and
2. how much dollar sales increased on the volume that did sell at the higher price.
When price elasticity is -1.0 or less (which is virtually always!), the net of the lower volume but higher revenue is almost always lower total revenue.
Hope that helps!
Hello, this series has been extremely helpful. We typically use $ volume rather than EQ.
Would you be able to elaborate on the two calculations you outlined above?
1) This is what this post outline, correct?
2) How do you isolate the volume that sold at the higher price?
Thank you!
Thanks for the kind words – glad you are finding the blog helpful!
Regarding the calculations…there is a separate post that addresses specific calculations fo reach business drive. Part 3 of the series talks about price. As you can see in that post, I do not isolate the volume that did not sell on promotion. I applied the base price elasticity to total volume. This is a simplified way to do it and the answer is pretty close to what you’d get by including separate rows in the analysis for base price and promoted price. Since you do this on $ sales instead of EQ volume, there’s an extra element that you need to account for. Go ahead and contact me using the Contact Us form if you want to discuss further.
Hi, I use a database that has some limitations. The data is bi-monthly (one data point for two months combined i.e. Jun/Jul 16 etc.,). I don’t have a measure for “Any Promo Distribution”. There is also no baseline / incremental information. Would I still be able to do a rough version of this analysis? what are the compromises I can make?
What you can include in this type of analysis does depend on what facts you have available on your database. Even with bi-monthly data you could probably include price and distribution (and also competition – post on that coming soon), plus All Other. If you want to discuss further, please use the Contact Us form and we can set up a phone call.
Thanks for the great article. I can`t find the article about impact of competition. Did you post it or it`s in future plans?
The post on including competition in the volume decomp should be posted sometime this month. Thanks for asking!
Hi Robin, I’m curious if you have any materials/links to explain how to calculate the elasticities for each driver in the analysis? Is it as simple as the delta in demand over delta in driver?
If you take a look at each of the 5 posts in this series you’ll see that I explain where the elasticity comes from for each driver. Unfortunately the calculations are not as simple as you proposed. If you just calculated change in sales divided by change in each driver, there would be double-counting. The main point of doing a volume decomposition is to control for all the drivers happening together and not attribute the entire volume change to any one driver. Hope this helps!
Thank you for the reply! That makes sense since your using the change in volume in more than one elasticity calculation. Thank you for these amazing posts!
Hi Robin,
Is this effective looking at a single retailer? I would like to do a Due-to looking at only one major retailer, this won’t throw off the CWW will it?
Thanks!
TJ
Yes! You can do this for any level of geography. In fact there is usually less “Unexplained” at the lowest level of one retailer in one market. CWW and all other measures should be fine.
Your blog is awesome. Is there a reason you don’t try to include velocity as a driver in the decomp? Is it because it is so highly correlated with other drivers?
Thanks for the compliment! We’re glad you’re finding the blog useful. I don’t include velocity in the decomp because it would be double counting. All the other drivers except distribution are what drive velocity so you can include either velocity or the other drivers but not both. If you want to know the impact of the change in velocity, it’s just the sum of the impacts of all drivers excluding distribution. Hope that helps!
how does IRI count F&D in stores? do they count store end caps that change every week or does the F&D have to be off shelf and end cap?
Kristi, I see you are from Pepsico. I would consult with IRI directly since there may be special parameters for coding some of your categories (like CSD). However, generally, if it’s a promotional, secondary location then it would be counted as a display. This would include end caps as well as other locations such as lobby, perimeter, in-aisle, shipper, and also promotional/seasonal aisle.
Why do you use EQ volume instead of just volume at the brand level…I know you mentioned it’s because the brand has products of different sizes, but wouldn’t total volume at the brand level take this into account anyways?
Also how would the analysis change if you were doing it at the sub-brand or product level? thanks!
In many databases, EQ and Volume are the same thing. The main point is to use equivalized volume and not Unit Sales. If the items in the sub-brand are all the same (or similar) sizes, then you can do the analysis with wither EQ or Unit Sales. If when you say “Product” level you mean item level, then again either EQ or Unit Sales can be used in the volume decomp.
Hope that helps.
How do you determine if a new or existing item has been “incremental” to the category? That is, how can you determine if the item has brought in new buyers or caused current buyers to buy more, rather than just cannibalize sales from other items in the category. It seems that companies are always talking about whether an item has truly been incremental to the total category. Thank you for your help!
The best way to determine if a brand or item has been incremental to the category is to a Source of Volume (SOV) analysis. This analysis is based on household panel (not scanner/POS) data. It should be conducted after at least 3 months or longer (if the product has a longer purchase cycle). It looks at buyers of the new product and their category purchases in the period before the introduction, usually 1 year, and compares that to the period after the new product has been in-market. You see what portion of the new product volume and buyers were incremental to the category vs. came from other brands. As you might imagine, very few new products are truly incremental to the category but steal/cannibalize from existing things. The SOV also tells you which brands the new product sourced from – hopefully competition and not other items of the parent brand!
Hope that helps!
Thanks for the article, Robin. It’s informative and useful.