Nielsen and IRI applications make it easy to create spreadsheet based reports that can be refreshed every month. But in their older systems like Nielsen Nitro and IRI XLerate, there is minimal formatting. Their newer web-based systems like Nielsen Answers and IRI Liquid Data apply more formatting but that formatting doesn’t necessarily look the way YOU want it to.
Luckily, you can easily set things up in Excel to get around this problem. Follow the approach below and you’ll save yourself hours of time formatting every month. Format once and forget it!
First, you create one sheet in your workbook for the “raw data” aka the data from Nielsen/IRI (with or without formatting). This sheet will be refreshed through your data link to Nielsen or IRI.
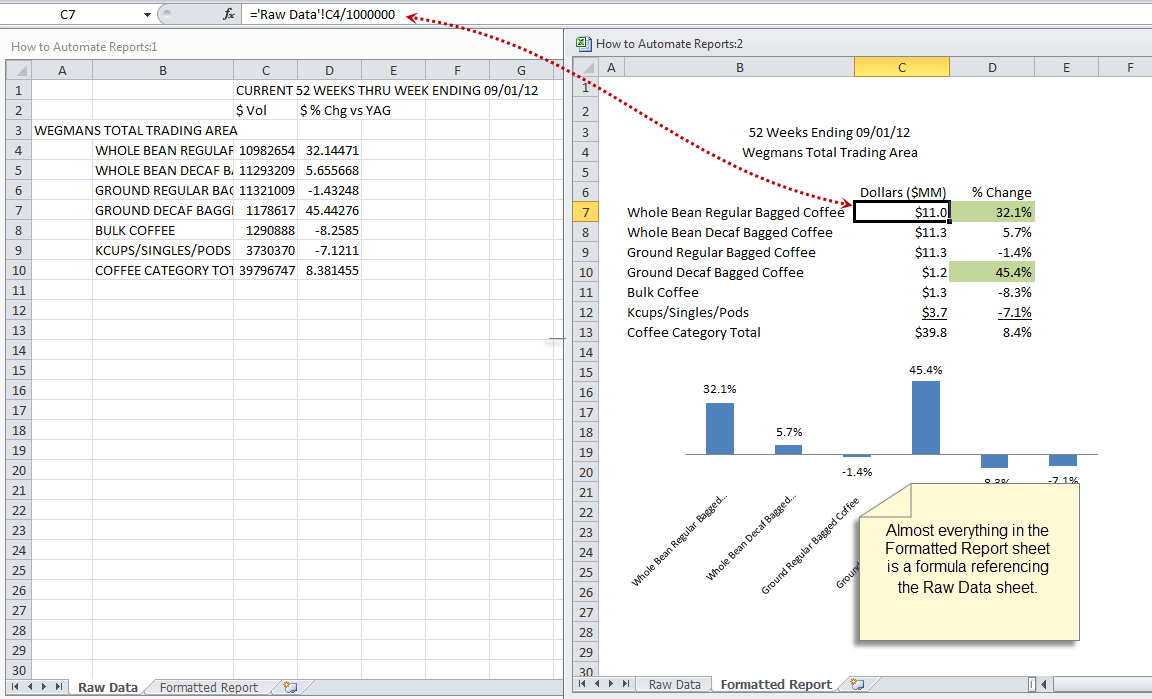
Second, you create a separate sheet which will be your formatted report. And here’s the trick: this second sheet is all formulas, referencing the raw data sheet.
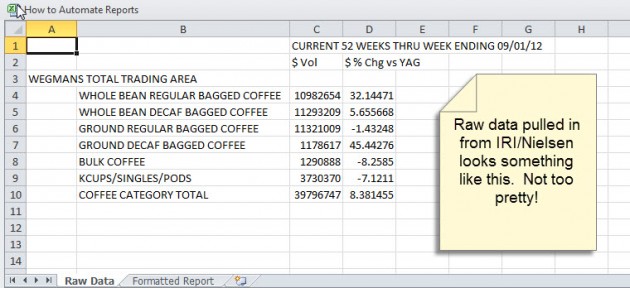
Here’s an example of how data often looks like when it comes in from Nitro or XLerate (using entirely made up data so don’t get all excited if you sell coffee) :
Your first instinct might be to start reformatting the cells in this spreadsheet. Don’t do it!!! Most of that formatting can be lost when you refresh (i.e. download fresh data from IRI/Nielsen) next month or pull data for a different account or time period.
Instead, make a new sheet that references the raw data sheet. In my example below, every single thing that might change is a formula. The segments, time period, account name, the numbers themselves, the graph, and even the highlighting are all formulas.

Looks a lot better, right? Hey, you’re on your way to a dashboard!
Remember, you can use this same approach if your Nielsen/IRI data pulls already have a lot of formatting. Just treat them like raw data and reformat all or part of the report in a second sheet using formulas referencing the first sheet.
In future posts, I’ll write about some of the functions I used to create my formatted report and why. So stay tuned for more Excel tips.
If you would like a copy of the spreadsheet I used to create the report automation example, email me and I’ll be happy to send it to you.
If you want a deep dive on this, a good book is Excel Dashboards and Reports for Dummies.


Hello,
I am working with Nielsen Answers and need to create dashboards for my team. I have all my data outputs and im able to export to excel. I also have my templates created. How do I link both so that when I run a new version of the report it will export to excel and populate my templates?
There are 2 ways you can do this:
1. If you created the Nielsen data ranges/queries as “refreshable,” then the raw data sheets would be among several sheets in the file. Your output (nice-looking dashboard) sheets would also be in the same file, referring to the data sheets. There would also be a sheet called “TOC” (table of contents) that is generated by Nielsen when refreshable ranges are created. When new data is available, you would need to click on “Edit Data Selections” at the top of each raw data sheet and run for the new period. Then the dashboard sheets that refer to the raw data sheets would also be updated. You’ll probably want to hide the TOC and raw data sheets after you update so that end-users only see the dashboard.
2. If the data ranges are not refreshable, hopefully you saved them in Answers. I assume you have sheets in the dashboard file that have the raw data from Nielsen and that the dashboard refers to those sheets. You would go to Answers and update each saved data pull, export results to Excel and copy/paste into your file. The dashboard should be updated. Again, you can hide everything but the dashboard for end-users.
Hope this helps!
Hello,
I am working in IRI. Can you share how I can make a pull refreshable?
Thank you!
Sorry we don’t have the answer to that one! Your IRI client service rep would be the best source of help. I do know that in the Nielsen system I use, the option to make the file refreshable appears under advanced options in the download menu, so you could hunt for something similar in your IRI system.