As mentioned in a previous post, shoppers cannot buy something if it’s not in the store! That’s why having good distribution is so important to your business. What can you do to increase distribution when your brand is already in at least 90% ACV distribution?
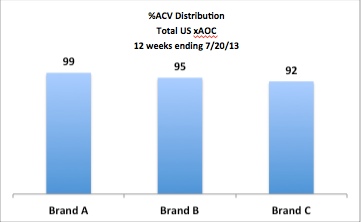
Let’s look at an example. Say there are 3 brands in a category, with national brand distribution as shown in the graph below. Which would you say has the best distribution?

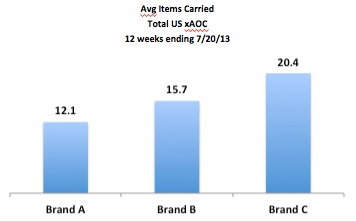
If this is the only information you have, then the answer would be Brand A, since it is in 99% of the ACV. But what if you learn that each brand has a different number of Average Items Carried, as follows:

Now your answer might change to Brand C, since they have over 20 items while Brand A has only about 12 items. There are really two “dimensions” with respect to distribution: breadth and depth. % ACV Distribution measures the breadth, or how widely a product is available. Another fact, Average Items Carried (sometimes called Average Items Selling), measures the depth or how many items are available in stores where the brand is available.
The fact Average Items Carried (in Nielsen) or Average Items Selling (in IRI) is usually available right in your database, so go ahead and start using it if you are not already doing so. You may uncover some hidden opportunities for your brand! (Click here if Average Items Carried is not in your database and you need to calculate it in Excel.)
Did you find this article useful? Subscribe to CPG Data Tip Sheet to get future posts delivered to your email in-box. We publish articles twice a month. We will not share your email address with anyone.

I’m just learning about these metrics (TDP, ACV, etc.) and I must say, these articles are extremely useful and very easy to understand! Love it, thank you.
Thanks for the positive feedback! We work hard to be both thorough and clear – it’s nice to know we’re succeeding.
How do you calculate estimated CE volume if you were to reach 100% distribution?
I’m not familiar with the term “CE volume.” Can you please explain what you mean by that?
Sorry, that was redundant, just volume. CE = case equivalent
Take a look at this post on quantifying the increase in sales when you increase distribution. This example is in dollars but you can do the same calculation for cases. If “Case” is the EQ in your database this is very straightforward. If you do not have cases as a measure in your database, then you should do this for units at the item level and then convert to cases. Use the “Contact Us” form if you have any more questions on this.
Robin & Sally,
You’ve already done a great job with CPG terms. What would be great to know, is some of the emerging terms in the wake that are becoming crucial to marketers with increasing digitization across the mix.
For example: how is distribution depth, width, weight, etc. measured on e-commerce channels. And when one tries to combine e-commerce with physical distribution, are there any terms that provide a holistic view. These might not be accepted throughout the industry – but could be something that Nielsen or equivalents are using.
Similarly: when it comes to media, there are tonnes of measures on the digital side with a lot of them being not too relevant. But to get a holistic view of media across all channels, is there a good measurement that combines it all. Are there some kinds of analysis to run in such situations.
My second request, if you could be kind enough to accomodate. When working on brands where elaborate panel or shopper data source isn’t available, is it possible to have some kinds of surrogates. If yes, how to work with them and analyse them in a more scientific manner so that they provide results with some decent degree of confidence.
My final request, and this might seem extremely silly to most, but it was crippling to me very early when I started. While terms like YTD, MTD, YTD LY, AOP, Last 52 weeks, 52 week rolling, 4 week rolling, etc. are so simple when you understand them, there is an art to using them in the right places. Some trends become obvious when seen through 4 week lens versus 12 week lens. Sometimes, it is better to look at YTD as opposed to YTD LY. My request is around these kinds of simple ways of cutting and slicing and presenting your data to get the best out of it. For example, when should one compare sales to last year, to the beginning of the year, to AOP ambitions and show it as absolute, versus 4 week rolling, versus 52 week, etc. Sales is a placeholder here, but I guess you get the point through this example.
I guess too many requests in one comment and rambled as well. Would be wonderful to see any of these being answered.
Rahul, Thank you so much for all the topic suggestions. Your questions are great ones. Some of them are tough to answer but Robin and I will talk about this and see where we think we can shed some light.