There may be an opportunity to increase sales at some retail customers by making sure that you are getting your fair share of distribution. The basic concept is that if your brand has, say, a 25% share of category dollar sales then it should also have at least a 25% share of the category distribution.
I’m sure you already know how to calculate share of category dollar sales. But how do you calculate your share of category distribution? % ACV Distribution doesn’t work – most categories and many large brands will have 100% ACV Distribution, so that measure doesn’t differentiate well. Instead, the best way to calculate share of distribution is to use Total Distribution Points or TDP. I recently wrote a whole post about TDP’s. In short, it’s a sum of % ACV Distribution for each item in a category, segment or brand.
The calculation for Fair Share of Distribution is:
Fair share index = share of TDPs / share of dollar sales * 100
Sample Calculation
- Brand Share of Category TDPs 12.8%
- Brand Share of Category Dollars 15.0%
- Fair Share of Distribution Index = 12.8 / 15.0 * 100 = 85
How to Use With A Retailer
If fair share index is < 100, then there is an opportunity for the retailer to increase your distribution by adding items or expanding to more stores, ideally at the expense of your competitor(s) who are receiving greater than their fair share of distribution (index > 100). If your index is > 100, then there is, of course, no need to bring this to the attention of your retail customers! If, based on the fair share index, you do have a case for increasing distribution, then you’ll want to do additional analysis to figure out what specific changes should be made.
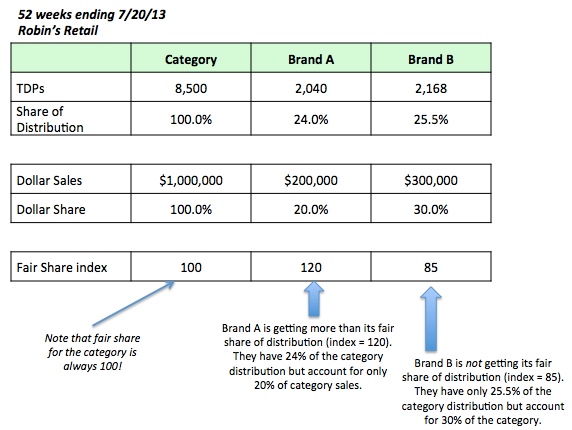
Take a look at this example. Brand A should not share this with this retailer, while Brand B can use it to hopefully gain more distribution at the expense of Brand A.

Fair Share can be used in many different ways – see another example here.
If you enjoyed this article, subscribe to future posts via email. We won’t share your email address with anyone.

This is very insightful (looks very similar to a space-to-sales index). I’ve been delving into IRI data for the past year as an analyst for a wholesaler, and I’ve learned a lot from reading through this site.
Greatly enjoying the articles on this site! I’m just beginning to study CPG and look forward to reading the blog from oldest to newest.
I also have a question: would it be appropriate to use Sales per Point of Distribution to estimate the impact of fine-tuning the distribution? In other words, Brand B has SPPD of $138.38 ($300,000/2168), Brand A has SPPD of $98.04 ($200,000/2,040) – which is a “gap” of $40.34 between the two brands. Brand B is under fair share by 4.5% while A is over by 4.0%, thus we would make the argument (as BM of Brand B) that we should absorb Brand A’s 4% overage giving us an extra 340 points (.04*8500) and thus be worth an estimated $13,716 ($40.34* 340).
Thanks! And sorry if this is discussed somewhere else. The hyperlinked example seemed slightly different as it talked about the category overall.
Here is my understanding of what you’re asking:
1. My brand is not getting its fair share of distribution (which means some other brand is getting more than its fair share of distribution).
2. My brand has a higher SPPD (velocity) than another brand that has a lower velocity but greater than fair share of distribution.
3. How can I use that fact to get a retailer to shift some distribution from the slower-moving brand to my brand?
I will be addressing this in more detail in a future post but in a nutshell, you are on the right track with your line of reasoning. If Brand B gets/steals an additional 340 points of distribution from Brand A, the opportunity for Brand B is actually $47,048 (= additional 340 points * Brand B velocity of $138.38). The increase in sales to the category would be $13,716 (340 points * velocity increase per point by switching distribution to Brand B from Brand A).
Hope that helps!
I find the best blogs ever written on any Cpg data here.
At what level can we use this approach Manufacturer, brand or can we include sku level also.
And what would have been the impact if brand B SPPD change was negative as compared YA
Yes, you could do it at the sku level. It’s not typically done at that level, probably because we don’t usually think of “SKU Share” and, if you have a lot of sku’s, it would get very complicated to think through and present. But there’s no reason you couldn’t look at it by sku if you thought it might make sense in a particular situation.
This analysis is focused on the current situation and ignores trends. But of course any argument you make for increased distribution might be undercut by someone pointing out negative trends in another metric.
hi Sally and Robin – in doing this exercise, I notice that once I gain my fair share of TDP, then my resulting overall sales volume is a higher share than the original dollar share. For example, if I have 45% of $ share, and only 36% of TDP share, I need to gain 9% of TDP share to achieve my fair share. When I do the calculation for the opportunity dollars available by gaining those 9 points, based on my dollar velocity, and then add the opportunity dollars to current dollars, I actually end up with my dollar share being 56%, not 45%. Is this because I have a higher dollar velocity than other brands, or because the entire market size grew along with my sales volume? Or something else I am completely missing? Thanks!
It’s always great to see readers applying lessons from the CPG Data Tip Sheet in real life! You did uncover the chicken-and-egg nature of fair share analysis. To keep things simple, if your sales increase along with your distribution but the category sales (denominator in share calculation) do not increase then, yes, your share will go up. You could make an assumption to increase the category a bit vs. keeping it flat so that your share does not go up way too much, ie. in an unrealistic way. Hope that helps!
hi Robin, thank you, I did end up increasing the overall category with my additional opportunity dollars and it came back in line with a more realistic observation. As always, thanks for the tips! We just used these examples for a sales meeting with our reps, and the slides were a hit. I am so grateful for this resource from you and Sally. 🙂
Happy to help!