• Skip to primary navigation
  • Skip to main content
  • Skip to primary sidebar
  • Skip to footer

CPG Data Tip Sheet

Transforming your syndicated data into business insight

  • Home
  • Glossary
  • About Robin Simon
  • About Sally Martin
  • Contact
Blog » How To Get Started with Nielsen/IRI » A Tale of Two Nielsens

A Tale of Two Nielsens

June 1, 2021 By Robin Simon 4 Comments

Print Friendly, PDF & Email

As you may have noticed from the industry press, LinkedIn or emails received directly from Nielsen, a lot has happened to the Nielsen company in the last few months.  If you’ve seen the above logo on the right then the message has been getting out to industry stakeholders.  Nielsen clients should be familiar with the content in this post but others may still be a bit confused.

On November 1, 2020, this announcement came out that Nielsen Holdings Plc was selling its “consumer goods data unit” to a private equity firm.  That deal was completed in early March, 2021.  (At end of 2019 the company announced that it would be split into two publicly traded companies but that plan was postponed due to the pandemic.)

At a high level, the company that has the data that we talk about on CPG Data Tip Sheet comes from the new NielsenIQ and Nielsen is all about media:

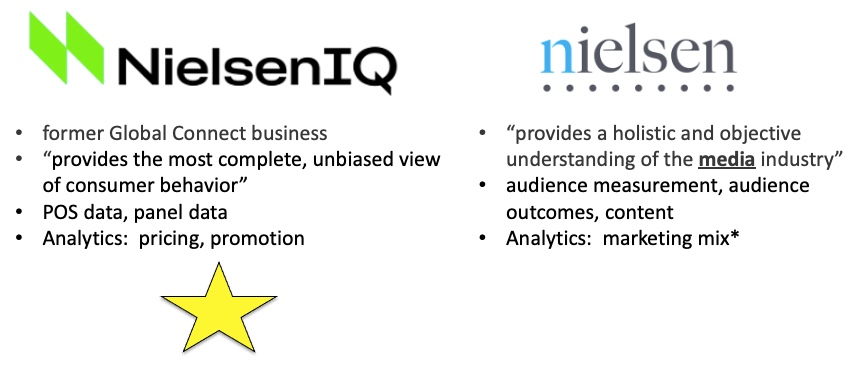
*Note:  Marketing Mix projects are now offered by Nielsen, using data provided by NielsenIQ.  Clients would deal with both vendors:  Nielsen for marketing mix and NielsenIQ for ongoing retail measurement data and other analytics.

We welcome any of our readers who work at Nielsen or NielsenIQ to provide additional information or corrections in the Comments.

Share
Tweet
Share

Filed Under: How To Get Started with Nielsen/IRI Tagged With: Nielsen, NielsenIQ

Reader Interactions

Comments

  1. Jason Zelinski says

    June 2, 2021 at 10:52 am

    Robin,
    Love your site and direct clients to it all the time!
    For NielsenIQ we also ingest Loyalty Data and provide Analytics on Loyalty & Assortment.

    Thanks!

    ~Z

    Reply
  2. Nancy A says

    June 2, 2021 at 5:20 pm

    I utilize both Nielsen (Answers on Demand) and Nielsen (Connect).
    I’ve been the recipient of these communications from Nielsen.

    Have to say — I love love love Connect! I’m an old “Nitro” girl…and go back even further into the late 80s/early 90s where there was no platform, just data code to request info! 🙂

    Reply
  3. J L says

    October 27, 2022 at 2:54 pm

    Since so much has changed between Nielsen, IRI, and SPINS, I think it’d be super helpful if you were able to put together something about the most recent key differences between programs. I’ve been talking to all the big three data providers to see if we want to renew or run away from our current provider, and so much has changed in 5 years! IRI has unify plus, Nielsen has Byzzer, Discover, and others, SPINS has a relationship with IRI so you can get conventional channels pulled in with your natural channels…The tools out there today are incredible and if you ever need an idea for some content that I think will attract a lot of traffic, this would be a good one!

    Reply
    • Sally Martin says

      November 1, 2022 at 7:41 am

      Thanks for the suggestion! It’s true that the access tools are always changing.

      Reply

Leave a Reply Cancel reply

Your email address will not be published. Required fields are marked *

This site uses Akismet to reduce spam. Learn how your comment data is processed.

Primary Sidebar

Top Posts

  • The 2nd Most Important Measure: % ACV Distribution
  • Velocity: How Well Your Product REALLY Sells
  • Total Distribution Points: Master of All Distribution Measures
  • xAOC and MULO: Multi-Channel Markets in Nielsen & IRI
  • The Beginner’s Guide to Trade Merchandising Measurement

Search CPG Data Tip Sheet

Subscribe to New Posts

Get new posts delivered straight to your inbox. We won't share your email address with anyone.

Thank you for subscribing!

Subscribe

About CPG Data Tip Sheet

We (Sally Martin and Robin Simon) first met in business school and bonded over our interest in geeky marketing stuff. Eventually we both started independent consulting practices. Now we’ve reunited to share with you some of what we’ve learned in our decades of experience working with syndicated CPG data.

Categories

  • Glossary (79)
  • How To Answer Business Questions (42)
  • How To Communicate Insights (17)
  • How To Get Started with Nielsen/IRI (22)
  • How To Understand Your Database (12)
  • Know Your Measures: Distribution (24)
  • Know Your Measures: Pricing and Promotion (45)
  • Know Your Measures: Sales (21)
  • Miscellaneous (6)

Tags

ACV analysis examples analytic skills attributes average items base base weighted weeks career development category management channels characteristics coronavirus coverage factor covid-19 Database distribution due-to Excel tips Facts incremental markets Measures merchandising new items panel data periods pricing pricing strategy products promoted price quantify opportunity retailer direct data retailer markets shopper data store data Syndicated TDP the basics trade promotion trading areas velocity visualization visualizations volume bridge volume decomposition

Footer

Categories

  • Glossary (79)
  • How To Answer Business Questions (42)
  • How To Communicate Insights (17)
  • How To Get Started with Nielsen/IRI (22)
  • How To Understand Your Database (12)
  • Know Your Measures: Distribution (24)
  • Know Your Measures: Pricing and Promotion (45)
  • Know Your Measures: Sales (21)
  • Miscellaneous (6)

Search CPG Data Tip Sheet

Tags

ACV analysis examples analytic skills attributes average items base base weighted weeks career development category management channels characteristics coronavirus coverage factor covid-19 Database distribution due-to Excel tips Facts incremental markets Measures merchandising new items panel data periods pricing pricing strategy products promoted price quantify opportunity retailer direct data retailer markets shopper data store data Syndicated TDP the basics trade promotion trading areas velocity visualization visualizations volume bridge volume decomposition

Terms of Use | Copyright © 2025 CPG Data Insights · Log in