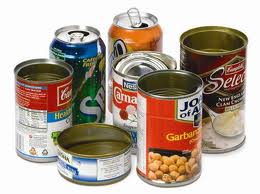


One of the 4 dimensions on every database is Measures (or Facts). This post is your one-stop shop for Measures in CPG Data Tip Sheet.
Measures fall into a few key groups and they often appear that way on your database to make them easier to find. Keep in mind that these group names and measure names may be slightly different at your company. If you already have a database, check with your IRI/Nielsen client service team for specifics on your database and ask them for a “measures guide,” which contains more detailed definitions.
- Sales
- Distribution
- Pricing
- Promotion/Merchandising
- Velocity
Sales
There are 3 ways to measure the sales of your products: dollars, units and equivalized units (sometimes called “EQ”). Unit sales are the number of packages (boxes, cans, bottles, pouches, etc.) bought by consumers and dollar sales are units times the price paid per unit. Equivalized units are unit sales converted to a common measure (like pounds or cases). If you are looking at a product level that contains things of different sizes, you want to use EQ as the physical volume measure. Dollar and unit sales are available on all databases, while EQ is usually an upgrade. Even if EQ is available in a basic database, sometimes it just repeats the unit values and sometimes the products are not equivalized to the same thing.
Distribution
We have written a lot about distribution. People cannot buy a product if it is not available in stores. %ACV is available on both syndicated and custom databases and Total Distribution Points and Average Items can be created on all databases (you may need some help from your Nielsen/IRI client service team for these). Also take a look at these previous posts about this very important topic: Distribution I, Distribution II, How To Identify Distribution Voids.
Pricing
All pricing measures are really calculated by dividing dollar sales by physical volume. Pricing in Nielsen/IRI is what shoppers are paying at retail – not what retailers are paying manufacturers for the product. The most basic pricing measure is average price paid per unit, which is available on all databases. We will write much more about pricing (and link to those posts as they are available), but for now will direct you to our Glossary entries for the various pricing measures available:
Upgrades available: Non-Promoted Price, Promoted Price, Base Price, Price by Merchandising Tactic, Price per EQ
Promotion/Merchandising
Even if you have no budget for consumer marketing efforts, almost all brands have some trade promotions happening. The least expensive option for merchandising measures is to get no information on this. Given the fact that Trade is typically one of the biggest costs in a brand’s P&L, we recommend upgrading to at least getting the key facts for non-promoted and promoted conditions. The highest level of upgrades adds base and incremental sales and pricing to that. Look for a future post coming soon that explains those measures further. Almost all measures available for total are also available by specific tactic (feature, display, feature & display, TPR): sales, distribution, pricing. Weeks of support and display execution are other measures available related to promotions that can be available on a custom database.
Velocity (or Sales Rate)
You can think of the measures in this group as a variation of sales, but adjusted for distribution. These facts are typically used by retailers (and, therefore, Sales) to compare brands and items to each other when determining what to carry and how much shelf space to allocate. Common velocity measures are Sales per Point of Distribution, Sales per TDP and Sales per Million. The first two can be calculated if they are not on your database, Sales per Million is an upgrade.

I’m just getting started with Nielsen and have been tasked with assessing performance of a new item. Should I use EQ Volume to compare performance across Total Category, Sub-category, 1 Single SKU?
If you are looking at any aggregates that combine items of different sizes, definitely use EQ volume for physical volume (and not units). If you are showing this to a retailer, then you should also look at Dollar Sales. Take a look at this post that explains when to look at the different measures of sales:
https://www.cpgdatainsights.com/measure-sales/3-sales-measures/
Hope this helps!
Hi
I have just started with Nielsen.I would like to see the growth of CPG/FMCG market of a particular city in a developing country. What is the best measure to capture this information. Thanks and Regards
The best measure to look at is probably % change in retail value vs. year ago (that would be dollar sales in the US). You could look at it on an annual basis or trend shorter periods (4-week or 13-week buckets) over time to see if growth is accelerating or slowing down.
The data available differs by country, especially for developing countries. You may be able to get growth in the whole country but maybe not in a specific region or city. The amount of history available also varies by country. It depends on the nature of the retail trade and the technology for collecting the data as to whether or not you’ll be able to get what you are looking for. Go ahead and contact Nielsen (and IRI, too) to see what they have available for the country/countries you are interested in. Both vendors have partnerships with local vendors in several countries outside of North America. Hope that helps!
Does anyone know what ‘weight volume’ measures?
Which data source uses that term? It could be the same as EQ or equivalized volume, as opposed to dollar sales or unit (package) volume. If you can send some sample data, please click on the Contact link above and get in touch that way.