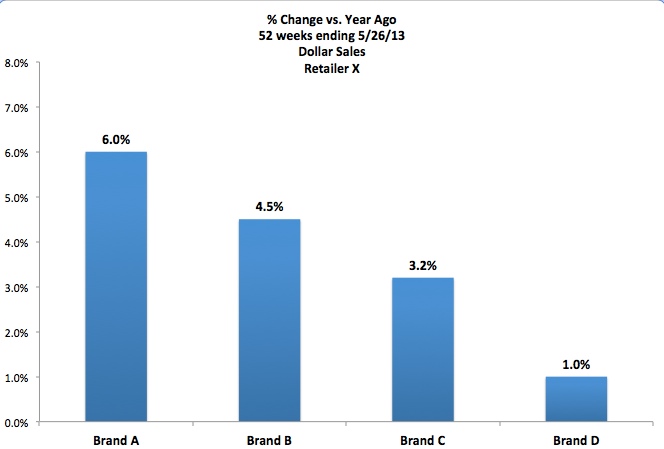
Assume there are 4 brands in your category at Retailer X, with dollar sales growth as shown in the graph below. Which brand would you say is performing the best? How about the worst?

Since this is not a trick question, Brand A is performing best with dollar sales growing the fastest, at +6% vs. year ago. Brand D has the lowest dollar sales growth, at only +1% vs. last year.
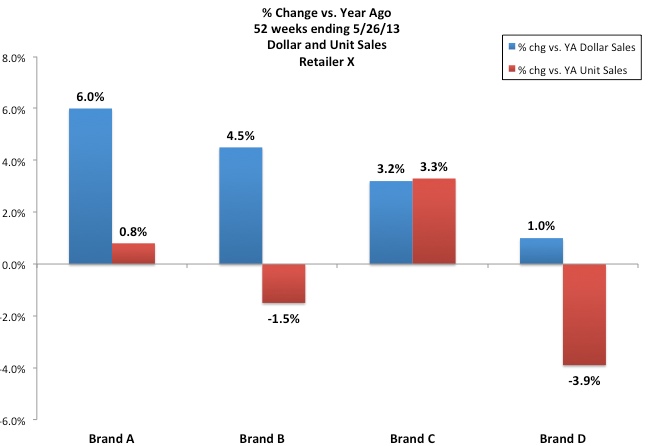
Now let’s look at unit (or package) sales. Do your answers change at all?

From Retailer X’s standpoint, your answers really don’t change, since they are most concerned with dollar sales growth. Once we consider unit sales, though, an argument could be made for Brand C performing best since their unit sales are growing much faster than the other 3 brands. Brand A’s dollar sales growth is coming from higher pricing, rather than selling more units. Brand B may not be in great shape over time, as their unit sales are actually down even though dollar sales are up. And what’s going on with Brand D? How can dollar sales be up +1% when unit sales are down almost -4%?
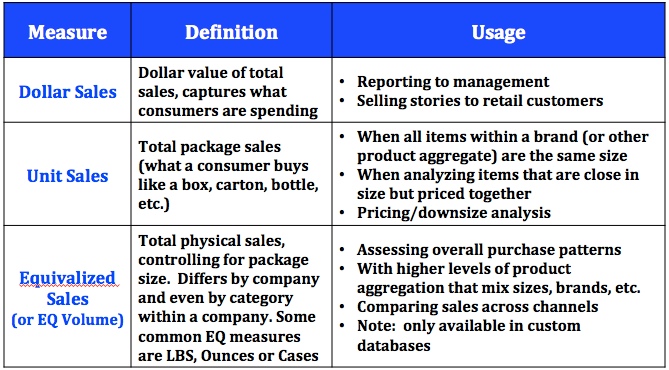
In order to get the most complete picture of what is happening, we need to look at all 3 measures of sales: dollars, units and equivalized (EQ) volume. (Note that most syndicated databases do not have equivalized volume, but you typically do get it in a custom database.)

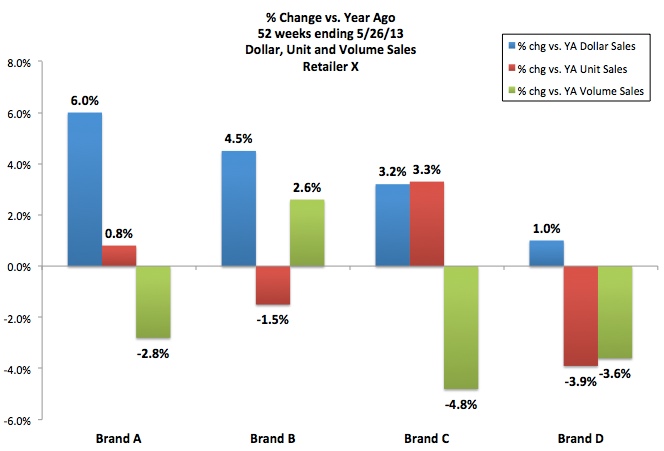
Now that we see all 3 measures of sales, a much clearer picture emerges.
- Brand A has growing dollar sales, relatively flat unit sales and declining EQ volume. This happens when the average price per unit is higher but each unit is, on average, a smaller size. In an attempt to maintain profit margins in the face of rising transportation and raw materials costs in the last few years, some manufacturers raised their package price while also making the packages smaller.
- Brand B has growing dollar sales, fewer units sold but higher EQ volume. This happens when the average price per unit is up and each unit is a larger size. This can happen when larger size “value packs” are introduced.
- Brand C has growing dollar and unit sales, but declining EQ volume. This happens when there is no real real change in average unit price but each unit is smaller. This situation has been quite common in the last few years as manufacturers have downsized their packages while maintaining the same unit price.
- Brand D has slightly higher dollar sales but declining unit and EQ volume sales. This can happen when the average package size stays the same but average price per package increases – another way for manufacturers to maintain profit margins when their own costs are going up.
So…make sure to look at various measures of sales before reporting business results. Dollar sales is probably the most commonly used sales measure and captures what consumers are spending, not what they are buying. Trends in dollar sales can mask what is really happening from a consumer standpoint. Taking a look at unit and EQ volume sales trends tell you if dollars are up because people are really buying more product or because prices have gone up. If you have access to EQ volume and unit sales, you should look at both of those, especially when package sizes have changed.

Measuring sales performance is often the starting point for any further analysis, whether you are in Sales, Marketing or another function at your company.
If you enjoyed this article, subscribe to future posts via email. We won’t share your email address with anyone.

Good morning.
Just returning to the CPG category after a 15 year absence. Great to find a resource like yours to reacquaint myself with the lexicon. So glad to have found you. Any other resources like yours for a guy like me would be most appreciated. Please keep up the good work.
Looking forward to hearing from you soon.
Thanks! Glad you are finding our articles useful. A great general site is Retail Wire for news and white papers. For more information about research and data, Quirks is good. I also recommend Category Management Knowledge Group (www.cmkg.org).
I’m just starting to get into this at a basic level. If we have one product in various sizes and packaging, how do we recommend on a retailer-by-retailer basis which one(s) to continue selling? Is dollar sales or unit sales more helpful with a small data set (less than a year)? How does distribution among stores factor in?
Retailers usually prefer to see things in dollars, since that what they take to the bank, not units! While you should them sales, you should also show them velocity. That measure controls for differences in distribution. That way items that are not as widely distributed (such as newer items with less history) are not penalized. See this post on velocity: https://www.cpgdatainsights.com/measure-sales/velocity-how-prod-really-sells/
There are several other posts on this topic on the CPG Data Tip Sheet, along with answers to questions that readers ask in the Comments. Hope this helps!
Really informative posts for those of us that may not have a marketing background. Do you have an RSS feed that you push out? This is how I aggregate a lot of content and it would be great to have the info sent there.
Curtis, Glad you like the site! I added an RSS button on the home page (under the subscribe by email option). Let me know if it works!
If your EQ units are up but dollar sales are down, this means purchases are being made at a lower price point? What would this occurrence be called
Yes, this would mean that more overall product sold but at a lower price point. I don’t think this happens that often, as brands rarely take their prices down over time! The examples in this post are the more common situations.
Your website has been so helpful to me! This is all great, thank you!
If your products are all packaged in the same type of case/packaging (all the same size), would you need to look at EQ still? Or would you recommend just focusing on dollar / unit sales?
Lindy, If every single item is the same weight or volume, then analysis of units and EQ would yield the same conclusions. But you would have to consider whether that was true for your competitors as well. Even if it’s true for your brand, EQ might still be relevant for category analysis if you competitors have different product sizes. Best, Sally
How do you calculate Contribution to Growth? I have always used:
( Total Brand Change / Total Category Change ) * 100 = xx.x%
The change can be dollars or units or volume. Brand could be vendor or pack or item. Whatever is used, the sum of the change always adds up to the Total Category Change and the percent contributions always add up to 100.0%. Is this the best method?
Hi Kenley, Your approach is fine as long as the brand and category are moving in the same direction. If changes in the numerator and denominator are in opposite directions it can be hard to interpret in real life. “Brand is up 15% and category is down -5% and brand accounts for -150% of category loss” is hard to wrap your head around! If a brand is up and the category is down you could say that increases in brand X were not enough to compensate for losses on other brands in the category, resulting in losses to the category. Of course if brand is down and category is up you probably wouldn’t be sharing that with a retailer!
How would you describe a situation about a brand where Dollar Sales % Chg vs YA is +15%, Unit Sales % Chg vs YA is +15%, but Volume Sales % Chg vs YA is -1% (or basically flat)?
I think that could be due to 2 things (or both happening at the same time): 1. Since you are looking at brand sales it could be a shift in product mix between items of different sizes, selling more of the smaller size(s). 2. The product was downsized (also known as a “weight-out”). For example, if the product was 16 ounces and now it’s 14 ounces but the price stayed the same. This seems like what’s happening in your situation – you sold 15% more units at the same price so dollars were also up 15% but the total ounces (or whatever your EQ is) did not increase since each unit sold had fewer ounces. Hope that helps!
Thank you very much! Very helpful!