• Skip to primary navigation
  • Skip to main content
  • Skip to primary sidebar
  • Skip to footer

CPG Data Tip Sheet

Transforming your syndicated data into business insight

  • Home
  • Glossary
  • About Robin Simon
  • About Sally Martin
  • Contact
Blog » Miscellaneous » Thank You, Readers on Our 10th Anniversary!

Thank You, Readers on Our 10th Anniversary!

November 30, 2022 By Robin Simon 4 Comments

Print Friendly, PDF & Email

Wow – it’s hard to believe we launched the CPG Data Tip Sheet 10 years ago this month.  It is a decade later and we are very happy to thank our over 6,000 followers!

In case you are relatively new to the CPG Data Tip Sheet, we went live the week of November 5, 2012 with 72 terms in the Glossary (with a few more added over the years) plus these 3 posts:

  • The 2nd Most Important Measure: % ACV Distribution (Part 1)
  • The 4 Key Dimensions In Every Nielsen/IRI Database
  • Big $ Question: Syndicated Database or Custom Database

These 3 posts followed, before the end of 2012:

  • The 2nd Most Important Measure: % ACV Distribution (Part 2)
  • How To Automate Monthly Reports (Even If You Aren’t An Excel Wizard)
  • Two Excel Functions That Can Save You Hours of Formatting Time

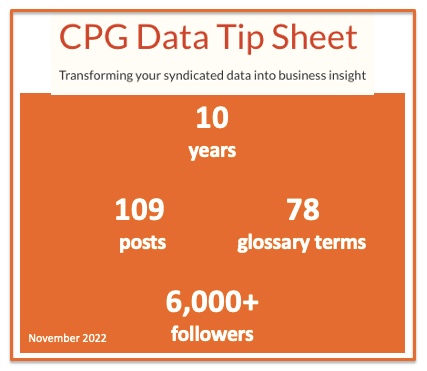
Here is a [very basic] “infographic” with KPIs, as of November 2022.  This focuses on our longevity and content, with only one measure (followers) related to performance.

Here are key metrics that appear in the WordPress dashboard, the platform we use for the blog.  These are always for the most recent 30 days and, therefore, change every day.  (Data pulled on 11/22/22.)

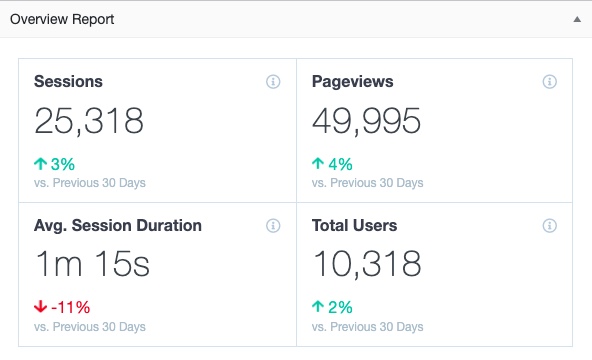
They do get at performance and reader engagement.  Let’s talk about 3 types of measures from this.

  1. Trends – Good news that 3 of the 4 metrics have increased slightly vs. the previous 30 days. The decline in avg session duration is not that concerning for us because it could be due to many things like length of the posts people read, time to read (many of our readers are from outside of the U.S. and English isn’t always their native language, etc.), what people are doing on the blog (reading one definition in the Glossary or going through several posts related to a particular topic), etc.
  2. Actual values – The numbers are good to help determine if maintaining the blog is worth our time and effort. Clearly the answer is Yes!  These numbers can also be used to derive other useful measures – see next point.
  3. Derived measures – from the actual values in the dashboard I can see that, on average:
    • Readers are looking at about 2 pages per session (49,995 / 25,318 = 1.97). Note that in that sentence it says “about 2” and not “1.97” – that was on purpose.
    • Readers returned to the blog between 2 and 3 times (25,318 / 10,318 = 2.45) during the past 30 days. Again, I purposely did not say “2.45” times.
    • Each reader looked at almost 5 pages (49,995 / 10,318 = 4.85).

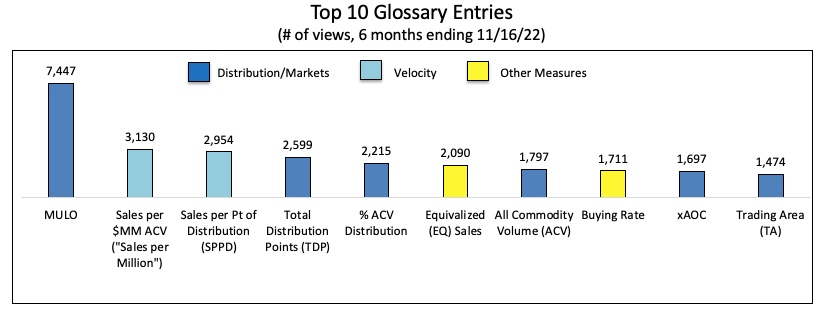
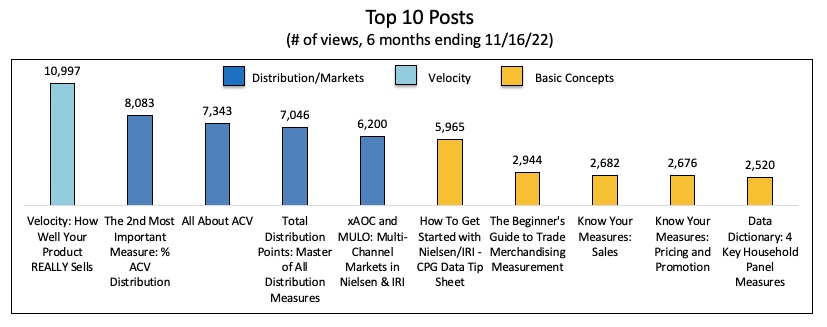
In case you’re wondering what people are actually reading on the CPG Data Tip Sheet (like we do!), the most popular things are related to distribution, velocity and getting started/basic concepts related to syndicated data.

Thank you, readers!  Did I mention there are over 1,200 comments on the blog and that we have a 16-page document with all the thanks and positive feedback we’ve received – and that’s just since 2017!  We look forward to continuing to provide this valuable resource for the industry.

If you enjoyed this article, subscribe to future posts via email. We won’t share your email address with anyone.

Share
Tweet
Share

Filed Under: Miscellaneous Tagged With: anniversary, blog performance

Reader Interactions

Comments

  1. Skip Dupont says

    November 30, 2022 at 3:18 pm

    Thank you! You have provided great information and even some personal attention when I needed it. I couldn’t do my job without the information your blog provides. Okay – I’d be able to do my job. You make me better at my job. Again, thank you so very much. And, I’m hoping you and the blog are around for at least another 10 years.

    Reply
    • Sally Martin says

      December 12, 2022 at 11:53 am

      Thank you for the lovely feedback!!

      Reply
  2. Mary Way says

    December 1, 2022 at 1:56 pm

    Thank you both for your dedication to keeping this blog going! It has proven to be such a valuable tool for me and my fellow analysts. There is nothing else out there that I have found as useful as your site with the glossary, articles, questions and comments. Here’s to another 10 years (or more!).

    Reply
    • Sally Martin says

      December 12, 2022 at 11:53 am

      Thank you so much!!

      Reply

Leave a Reply Cancel reply

Your email address will not be published. Required fields are marked *

This site uses Akismet to reduce spam. Learn how your comment data is processed.

Primary Sidebar

Top Posts

  • The 2nd Most Important Measure: % ACV Distribution
  • Velocity: How Well Your Product REALLY Sells
  • Total Distribution Points: Master of All Distribution Measures
  • xAOC and MULO: Multi-Channel Markets in Nielsen & IRI
  • The Beginner’s Guide to Trade Merchandising Measurement

Search CPG Data Tip Sheet

Subscribe to New Posts

Get new posts delivered straight to your inbox. We won't share your email address with anyone.

Thank you for subscribing!

Subscribe

About CPG Data Tip Sheet

We (Sally Martin and Robin Simon) first met in business school and bonded over our interest in geeky marketing stuff. Eventually we both started independent consulting practices. Now we’ve reunited to share with you some of what we’ve learned in our decades of experience working with syndicated CPG data.

Categories

  • Glossary (79)
  • How To Answer Business Questions (42)
  • How To Communicate Insights (17)
  • How To Get Started with Nielsen/IRI (22)
  • How To Understand Your Database (12)
  • Know Your Measures: Distribution (24)
  • Know Your Measures: Pricing and Promotion (45)
  • Know Your Measures: Sales (21)
  • Miscellaneous (6)

Tags

ACV analysis examples analytic skills attributes average items base base weighted weeks career development category management channels characteristics coronavirus coverage factor covid-19 Database distribution due-to Excel tips Facts incremental markets Measures merchandising new items panel data periods pricing pricing strategy products promoted price quantify opportunity retailer direct data retailer markets shopper data store data Syndicated TDP the basics trade promotion trading areas velocity visualization visualizations volume bridge volume decomposition

Footer

Categories

  • Glossary (79)
  • How To Answer Business Questions (42)
  • How To Communicate Insights (17)
  • How To Get Started with Nielsen/IRI (22)
  • How To Understand Your Database (12)
  • Know Your Measures: Distribution (24)
  • Know Your Measures: Pricing and Promotion (45)
  • Know Your Measures: Sales (21)
  • Miscellaneous (6)

Search CPG Data Tip Sheet

Tags

ACV analysis examples analytic skills attributes average items base base weighted weeks career development category management channels characteristics coronavirus coverage factor covid-19 Database distribution due-to Excel tips Facts incremental markets Measures merchandising new items panel data periods pricing pricing strategy products promoted price quantify opportunity retailer direct data retailer markets shopper data store data Syndicated TDP the basics trade promotion trading areas velocity visualization visualizations volume bridge volume decomposition

Terms of Use | Copyright © 2025 CPG Data Insights · Log in