As mentioned in this earlier post, you may be able to choose from over 200 different pricing facts on your database! One of the reasons there are so many price measures is because all of them are available for price per unit AND price per volume.
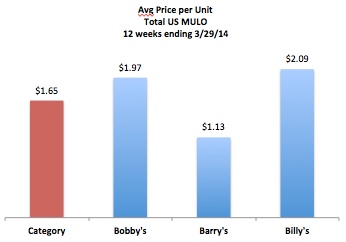
Price per unit is the retail price paid per package – the thing that the shopper buys. Take a look at the average price per unit for the following category, which is made up of 3 brands. What does this data tell us? Not much, unless you know more about the mix of items that make up each brand and the category.

At the category level, it never makes sense to look at price per unit. (Yes, I did say never! This is one of the few times I use that word with respect to data analysis.) This is because the category is made up of many brands which are priced differently and each brand can have different sizes or configurations which are priced differently. Even when you move below the category level, it rarely makes sense to look at price per unit for a total brand unless you know that there is only one size for that brand.
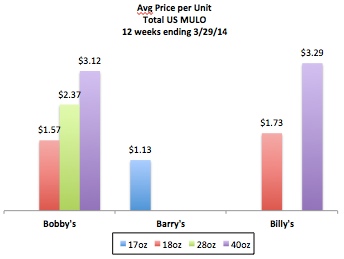
Let’s go into more detail on the items that make up this category. There are 3 brands and each brand offers different sizes. Here is the average price per unit at the brand/size level:
 Note that Bobby’s has 3 sizes (18, 28 and 40 ounces) while the other two brands only have one or two sizes. So the price per unit at the brand level is really like a weighted average of prices across the sizes. The price per unit is the same for Barry’s Brand and Barry’s 17oz because they only have the 17oz size, but comparing that to the price per unit for Bobby’s and Billy’s at the brand level really doesn’t make sense due to the larger sizes that they offer.
When comparing prices across brands with different sizes, you have 2 choices:
- Use promoted product groups
- Use price per volume (also called price per EQ)
Promoted Product Groups (PPGs)
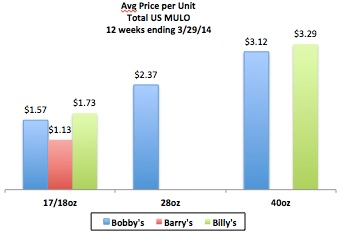
PPGs are groups of products that are priced and promoted together by the manufacturer and, usually, retailer. In the example above, there are 3 PPGs here essentially representing small, medium and large sizes: 17/18oz, 28oz, 40oz. It’s fair to compare the price per unit of 17 ounce and 18 ounce since they are so close in size and consumers are most likely considering them the “same size.” See the chart below which contains the same data as above, just arranged differently. Now it is easy to compare pricing between products across brands. Barry’s is clearly the lowest price and Billy’s has the highest price, even for each size.

Price per Volume
The other useful concept when comparing prices is to use price per volume, instead of price per unit. Price per volume is the price per equivalized unit. This basically takes into account different sizes and divides total dollar sales by total equivalized sales. (Read this previous post about dollar, unit and equivalized volume for a quick refresher.) Keep in mind that EQ and any measures derived from that are usually available in custom, but not syndicated, databases. (Read this previous post about syndicated vs. custom databases for a quick refresher.)
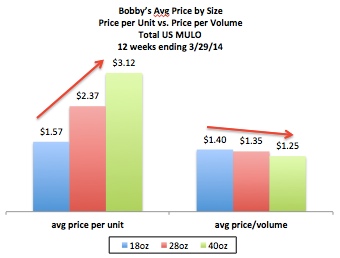
Let’s look at the price per volume vs. price per unit for Bobby’s, the brand that has 3 sizes. (Note that the EQ measure for this category is the very common 16oz, which is why the price per unit and price per volume are so close for the 18oz size.) Bobby’s pricing across sizes shows what you would expect: bigger sizes cost more on a per unit basis, but you get a “better deal” when buying bigger sizes.
 Looking at the price per volume for the category and different brands gives a better idea of the relative pricing between the brands.
Here’s a handy summary of when you should use price per unit and price per volume, summarizing the key points in this post:

Did you find this article useful? Subscribe to CPG Data Tip Sheet to get future posts delivered to your email in-box. We publish articles every 2-3 weeks. We will not share your email address with anyone.

Is it recommended to translate the results from eq to units once an analysis is done? Eventually eq is an intangible measure which the consumer doesn’t see.
If you are talking to an internal (manufacturer management, finance, marketing) audience, then price per EQ is usually fine. If you’re talking to either Sales or a retailer, then you’re right that price per EQ is not seen by a consumer. As long as the product is one size (or close to it), then price per unit is fine. If there are several sizes within a brand, segment or category, then you may want to report price per EQ and price per unit but also price per unit for each key size along with the proportion of sales accounted for by each key size.