
A product’s attributes are what makes it distinct from other products. Attributes include things like size, color, flavor, package type and other features that are relevant to the category. From a consumer perspective, these attributes are what determine the consideration set and influence the ultimate purchase decision. From a retail perspective, product attributes help define how aisles, departments and shelf sets are organized. Manufacturers use attributes to help define their products’ competitive set. (Note: “Attributes” are also known as “characteristics,” depending on your data supplier.)
When thinking about products, the largest thing is usually a category while the smallest is an individual item. There are times when you need to look at the entire category (to see if it’s just your brand that’s declining, for example, or the whole category) and other times when you need to look at items (to show retailers where your items rank within the category when selling in new items or when recommending changes to item assortment). There are also many other levels between category and item that are important and useful to look at. Product attributes tell you something about various aspects of a product and allow you to get at these other levels. Looking at product segments based on different attributes allows you to keep on top of important trends and more easily identify growth opportunities: Which is growing faster – small or large sizes? sweet or savory flavors? cans or pouches? floral, herbal, fresh or unscented? low sodium or gluten free? You get the idea!
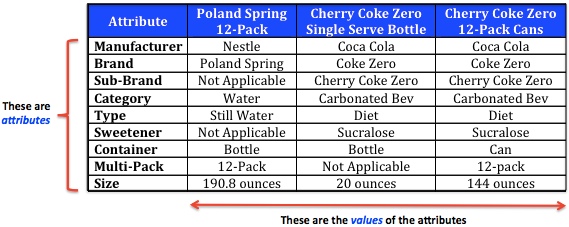
The most commonly used product attribute is probably brand, one of the many attributes available for all items in your database. Take a look at the following table to see some of the attributes associated with 3 different beverage products:


There are 9 attributes listed and each attribute can have only one value. All the items that are in your database are coded for several different attributes, all of which must be visible by looking at the package. Some attributes apply to all products. These include things like Manufacturer, Brand, Category and Size. Other attributes are only relevant for certain categories. In the example above, the value for Sub-Brand for the Poland Spring item says “Not Applicable” because there is no Sub-Brand. Similarly, the attribute Sweetener is not relevant. Food and Beverage products have Flavor as an attribute, but Household and Personal Care products often have Scent or Fragrance instead. Due to the current interest in Health & Wellness among consumers, there are dozens of attributes just having to do with things like Organic, Sodium, Sugar, Fat, Gluten and other health claims. These extra attributes can be made available on your IRI/Nielsen database, but for an additional charge. SPINS is a company that specializes in the natural and organic space, and they offer the most extensive attribute coding related to Natural products and Health & Wellness claims.
Once you are familiar with the attributes available in your database, you can look at the performance based on what’s important to you or your retail customers. Some examples using Beverages:
- How are various manufacturers/brands doing?
- Compare performance of different beverage categories – water vs. carbonated vs. juice
- Different containers – cans vs. bottles
- Diet vs. Regular
- Sucralose vs. Aspartame-sweetened diet drinks
- Multi-serve vs. single-serve packages
- Relative pricing between sizes
WATCH-OUTS
- Attributes are generally available at the item level only, not for product totals that add together multiple items.
- Be careful when relying on the attribute “Category” in your database. Even though all items are assigned to a category by your data supplier, those designations are somewhat arbitrary and may not be how your company likes to look at the category. Read more about defining your category in this previous post.
- Not all categories (and sometimes even items within a category) use the same unit of measure for the Size attribute. Some items may be in ounces and others in liters. The unit of measure is usually indicated in the value, but check with your IRI/Nielsen client service team if it isn’t.
- Many attributes have more detailed values than you typically want to use. You probably don’t want to look at all 250+ specific flavors when assessing general trends. Remember, the value for an attribute like Flavor is taken right from the package. So…Apple Cinnamon, Cinnamon Apple, Gingerbread Apple Cinnamon, etc. would all show up as separate Flavor values. A future post will explain how you can create your own groups of items based on the attributes in your database.
Did you find this article useful? Subscribe to CPG Data Tip Sheet to get future posts delivered to your email in-box. We publish articles twice a month. We will not share your email address with anyone.

Great post!
Where do Nielsen and IRI get values for attributes like “sweetener”? Is this information in the UPC or does it come from another source (like the manufacturer’s website)?
Does every product ingredient align with an attribute in Nielsen’s and IRI’s databases?
Thank you!
As far as I know all attribute data comes from the physical package itself, which now does include the ingredient list. If you are specifically interested in ingredients, take a look at Innova Market Insights. They do extensive work with ingredient lists and nutritional panels, in markets around the world.