
This is the fourth in a series of posts on quantifying the impact of business drivers on sales volume. Please review these posts first to get more context:
Part 1 – Overview of this very useful analytical technique that helps answer the question Why did our volume change?
Part 2 – Impact of Distribution
Part 3 – Impact of Pricing
Part 5 – Impact of Competition
And then the final post in the series, Part 6 – Impact of Everything Else
This post focuses on quantifying the impact of Merchandising (also called “Trade” or “Trade Promotion”). It is not easy to keep things simple when it comes to merchandising analysis! In the interest of simplification, I will only look at the impact of a change in the amount of support and assume there is no change in effectiveness of that support.
As with most aspects of trade promotion analysis, you should look at the 4 different merchandising conditions separately, as it is important to understand what you’re getting for all the trade dollars being spent and some tactics are definitely more expensive than others. The 4 conditions tracked by Nielsen/IRI are Feature Only, Display Only, Feature and Display, and Price Reduction Only (also called “TPR” for Temporary Price Reduction). If these terms are not familiar to you, read this post for a refresher on the merchandising conditions, also called “tactics.”
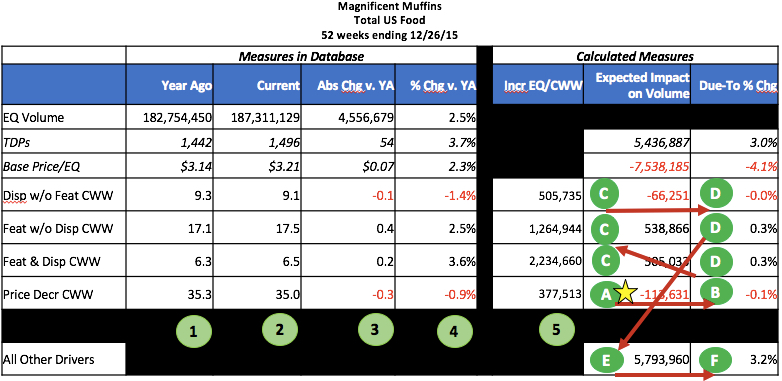
In this case study, we are explaining the 2.5% volume change for Magnificent Muffins, shown in the first line of the table below. I’ll walk through how to determine what the values are in the last 2 columns of the table based on the change in support levels, by tactic. For this post I am focusing only on the 4 merchandising rows, highlighted in blue.
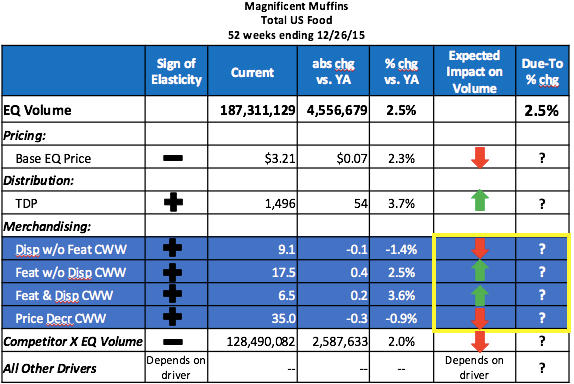
The measure I’ll use for amount of merchandising is CWW, short for “cumulative weighted weeks.” It is the most comprehensive merchandising measure, taking into account both the reach and frequency of merchandising support. Take a look at this post to see how it is calculated, although it is usually already available as a measure on most databases. For example from the table above, you would read it as “For the 52 weeks of 2015, Magnificent Muffins received just over 9 weeks of Display support (without Feature), down slightly from the previous year.”
Here’s the relevant data from the table above:
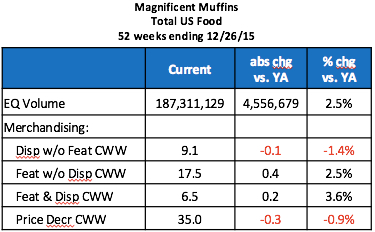
We see that volume sales are up +2.5% and the amount of merchandising support is up or down, depending on the tactic. Both tactics that involve Feature (with and without Display) are up while Display only and TPR (also called Price Decrease) are down. In terms of the expected direction of the sales impact for merchandising, you would expect an increase in the amount of support (CWW) to result in an increase in volume and a decrease in CWW to result in a decrease in volume. (This assumes that the effectiveness has not changed, which is what we are doing in this analysis.) So the question is: How much did the combination of additional Feature support but less Display only and TPR support impact volume?
A common way to determine this is to use incremental volume per week of support. This is equivalent to using an elasticity, like we did when determining the impact of distribution and pricing. Once I know that for each tactic along with last year’s CWW, I can quantify the impact of the changes in merchandising support.
Incremental Volume per Week of Support
The concept here is that for every week of support, you can expect to generate a certain amount of incremental volume. Although the total volume with each merchandising tactic is also available, that is not what we want for this analysis! The total volume with Display, for example, would include all sales in stores with Display, including what would have sold anyway if there was no Display. Incremental volume with Display is the additional volume you get because of Display. To learn more about incremental volume, read this post first then this one and to get really geeky about it, this one, too.
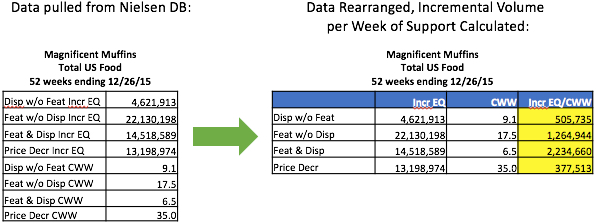
Although incremental volume per CWW is probably not a measure that you can pull right from your database, you can pull incremental volume for the different tactics along with CWW by tactic and then easily calculate incremental volume per week of support. For the Display tactic in Nielsen, for example, it would be:
Disp w/o Feat Incr EQ
Disp w/o Feat CWW
Calculating The Impact of Amount of Merchandising on Volume
To calculate the impact of merchandising on volume, follow the numbered steps in the following table for each tactic. (The numbers correspond to the calculations for TPR/Price Decrease only but you would do the same thing for the other tactics.)
The first 4 data columns are facts that are available in most IRI/Nielsen DBs or can be easily calculated from what is available:
- Year ago = value during the same period a year ago
- Current = value in current year
- Abs Chg v. YA = absolute change vs. year ago = Current – Year Ago
- % chg vs. YA = % change vs. year ago = (Current – Year ago) / Year Ago = Abs Chg v. YA / Year Ago
- Inc EQ/CWW – I showed you how to calculate this earlier in this post.
(Note that the row for TDPs and Price were calculated in these previous posts: Distribution, Price.)
The calculations in the last two columns need to happen in this order – first step is at the yellow star.
- Expected Impact on Volume of Price Decrease CWW = Abs Chg v. YA * Incr EQ/CWW =
-0.3 * 377,513 = -113,631. The loss of -0.3 weeks of support resulted in a volume loss of over 100,000 LBS. - Due-to % Chg for Price Decrease CWW = Expected Impact / Year Ago EQ Volume =
-113,631 / 182,754,450 = -0.1%. The loss of almost 1% of the weeks of Price Decrease support resulted in a -0.1% loss of total volume. - Expected Impact on Volume for the 3 other merchandising tactics – repeat step A above
- Due-To % Chg for the 3 other merchandising tactics – repeat step B above
- Expected Impact on Volume of All Other Drivers = Abs Chg in Volume – Expected Impact on Volume of Known Drivers so far. This bucket will change as you add more drivers to the due-to. At this point, All Other Drivers means everything else except Distribution, Pricing and Merchandising. The calculation is 4,556,679 – 5,436,887 – (-7,538,185) –
(-66,251 + 538,866 + 505,033 – 113,631) = 5,793,960. - Due-to % Chg for All Other Drivers = Expected Impact on Volume of All Other Drivers / Year Ago EQ Volume = 5,793,960 / 182,754,450 = 3.2%. Notice that the sum of the Due-To % Chg measures for Distribution, Pricing, Merchandising and All Other Drivers is the same as the % Chg vs. YA for EQ Volume (3.0% – 4.1% – 0.0% + 0.3% + 0.3% – 0.1% + 3.2% = 2.5%).
So to summarize…in this example, I am estimating that increases in weeks of Feature support (with and without Display) were more than enough to compensate for declines in Display and TPR support. In fact, changes in the amount of merchandising resulted in a net increase of 0.5% (-0.0% + 0.3% + 0.3% – 0.1%) out of the total volume increase of +3.0%. If nothing else changed besides merchandising support, Magnificent Muffin volume would have been up only +0.5%.
Looking back at our absolute change numbers, this result makes logical sense – it’s always good to do a gut check! The decrease in Display CWW was less than the increase in Feature & Display and Feature & Display usually drives the most volume. In addition, the biggest drop in support was Price Reduction Only, which is usually the least effective tactic. Therefore, just looking at the absolute change numbers for each tactic, I would have predicted a net positive gain from merchandising overall. And that’s what I got (+0.5%).
This still leaves +3.2% in the All Other bucket, even though I’ve now accounted for distribution, pricing and merchandising. My next post will add one more driver to the analysis (competition) but there will almost always be an All Other bucket, since we do not have data for all possible business drivers.
Hello – I really enjoy reading your blogs and tips! For some of them, it looks like the article should be expanded and I only see the beginning paragraph – am I missing something??
thanks much!
If you are on a preview page where only the first paragraph is shown, click on the article title to expand it. Thanks for reading!
Hi Sally,
When are you publishing the last driver i.e. effect of Competition?
I am eagerly waiting!!
I’ll be posting that later this month. Stay tuned!
Hello,
As a substitute for the trade due-to, I am using Any Promo EQ vol instead as the single measure to keep it ballpark. What elasticity would you recommend based on this?
Thanks,
Cal
You can use Any Promo instead of the individual merchandising tactics that are in the example. You would do the same thing as in the example – calculate incremental EQ per week of Any Promo support and multiply that times the change in weeks of support. Hope that helps!
Hi,
Question: say you stop using a merchandising vehicle entirely from YAG. So for example, the brand stopped using features over this year. This would make it so that CWW=0 and Increm Vol =0, but there is still a significant loss of Feature since that was the main vehicle last year. The issue is that Increm Vol/CWW is now an error (0/0) and we don’t know how much the loss of -241 Increm Feature Vol affected sales this year. Is there a way around this?
Thank you!
This situation may be simpler than you think! If you had 241 incremental volume from Feature last year and then 0 CWW of Feature this year, then you lost -241 volume from Feature. This is correct because we are using incremental volume from Feature, which is the volume you got because of the Feature. If we looked at total volume with Feature then you would have to make some adjustment to account for that volume that would have sold anyway.
Hope that helps!
Hi,
If the four tactics are mutually exclusive, how can the total CWW add up to more than 52 (weeks)?
Would it work to use units instead of eq vol when doing the analysis on a group of products that are the same size?
The tactics are mutually exclusive but…a retailer can use different tactics for different SKUs within a brand, which results in total CWW for a year being more than 52. If you use the less popular but more exact Base Weighted Weeks measure instead, annual BWW does not go over 52. See this post on BWW.
Yes, IF all the items in the product group are the same size you can use units instead of EQ.