
 As mentioned in a previous post, how you present your analysis is at least as important as the numbers themselves. Using the right graphs is an essential element that helps you tell a story with your data, rather than just report a bunch of numbers.
In this older post I talked about market share and how, whenever you are showing numbers that add up to 100%, your go-to graph should be a pie chart. This time I’ll show you how a stacked bar chart comes in handy when you want to show two different things that add up to 100% on the same graph. It’s hard to compare one pie chart to another so a stacked bar is often the better choice when analyzing share change over time or when comparing one measure of share to another.
Share Changes Over Time
A common example of this is when you want to show how shares have changed over time. In this example, we are looking at the dollar share of brands within a category over 3 years. We can see that Brand D was not even in the market 2 years ago and has gained 15 share points at the expense of Brands B and C (plus All Other Brands).
Dollar Share (and Point Change) by Brand
Total US, By Year
 Now let’s look at this same data in a stacked bar chart:

Using the stacked bar, it is easy to see:
- The entry and growth of Brand D
- Decline of Brands B and C, especially in 2012
- The growth of Brand A in 2012
- The decline of All Other Brands over two years
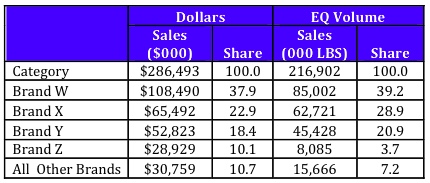
Dollar Share vs. Volume Share
If your brand is lower priced than other brands, you probably want to show volume share as well as dollar share to retailers.
Dollar Share vs. Volume Share by Brand
Total US, 52 wks ending 12/28/13
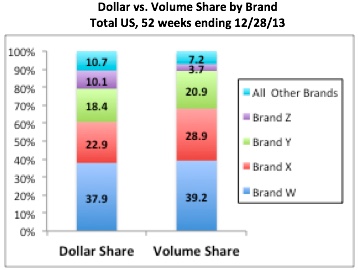
Using the stacked bar, it is easy to see:
- Brand X has a much larger “share of stomach” than “share of wallet”
- Brand Z (and All Other Brands) are much less important to the category on a volume basis than on a dollar basis
Dollar Share vs. Share of Distribution
I discussed the concept of fair share of distribution in this previous post. You can illustrate this nicely using a stacked bar chart.
Share of Dollar Sales vs. Share of Distribution
Retailer ABC, 52 wks ending 12/28/13
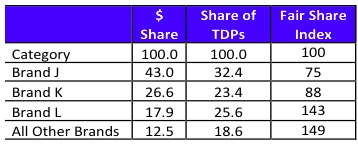
 The fair share index clearly shows that Brands J and K are not getting their fair share of distribution while Brand L and All Other Brands are getting more than their fair share of distribution.
WATCH-OUT: Make sure that the vertical axis ends at 100 since you’re showing share in a stacked bar chart. Sometimes Excel automatically makes it something bigger than that (like 120), which doesn’t make sense since all the shares must add up to 100.
Did you find this article useful? Subscribe to CPG Data Tip Sheet to get future posts delivered to your email in-box. We publish articles once a month. We will not share your email address with anyone.
Leave a Reply