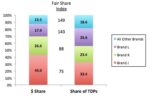
As mentioned in a previous post, how you present your analysis is at least as important as the numbers themselves. Using the right graphs is an essential element that helps you tell a story with your data, rather than just report a bunch of numbers. In this older post I talked about market share and […]
market share
Picture This: Market Share
How you present your analysis is at least as important as the numbers themselves. One of the most basic measures to gauge how well your business is doing is share, what portion of category sales your brand accounts for. Of course, higher is better and the sum of shares for all brands in […]