• Skip to primary navigation
  • Skip to main content
  • Skip to primary sidebar
  • Skip to footer

CPG Data Tip Sheet

Transforming your syndicated data into business insight

  • Home
  • Glossary
  • About Robin Simon
  • About Sally Martin
  • Contact
Blog » Know Your Measures: Distribution » Estimating Brand Distribution If You Only Have Item Level Data

Estimating Brand Distribution If You Only Have Item Level Data

July 1, 2018 By Robin Simon 4 Comments

Print Friendly, PDF & Email

Here’s a recent question we received from a CPG Data Insights reader:
“I know that ACV is not additive, but is there a way to calculate total ACV for a Brand when you have 5 UPCs with ACV measure? Can you average the ACV of the 5 UPCs for total Brand ACV?”

Before I answer the question, let me answer another question that some of you may have:  Why would somebody ask this?  For many small companies or ones that are getting syndicated for the first time, they are likely to purchase ad hoc reports in Excel, rather than getting access to an on-going database.  The most common ad hoc report is an item ranking report.  This gives the manufacturer an idea of what items and competitors are in their category and the relative performance.  Retailers will sometimes require that manufacturers selling in new items show them item velocity data and recommend which existing items the new items should replace on the shelf.  And…an item ranking report only has item level data in it, plus a category total.  Brand totals are not in an item ranking report, even though it is very useful.  You can always sum up individual items to get to brand sales but distribution measures are not additive, so you need way to estimate brand level distribution.

So back to the original question:  The short answer is No, you should not average the ACV of items to get total Brand ACV.  (Let’s assume that the reader means % ACV here, which is extremely likely.)  Read this post as a reminder on ACV.

While you can take the average of the individual items, that would understate the Brand ACV.    Remember that a brand gets credit for being in distribution in a geography for a period if:

  • at least 1 item in the brand scans in
  • at least 1 store in the geography in
  • at least 1 week in the period.

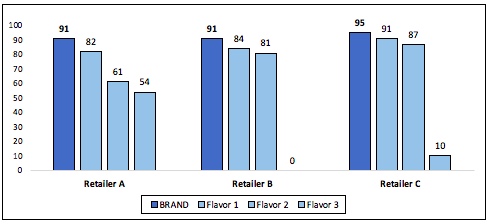
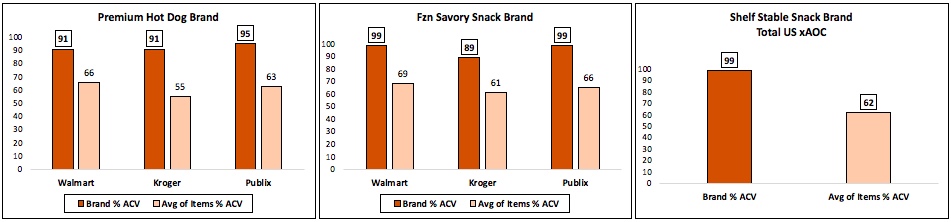
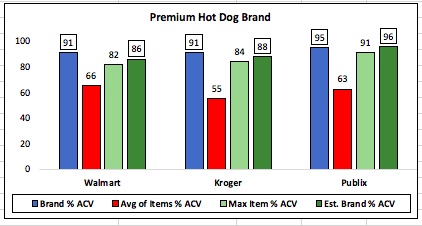
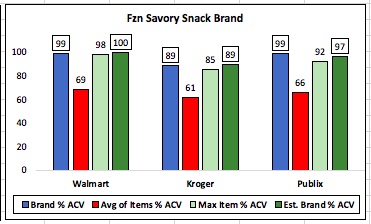
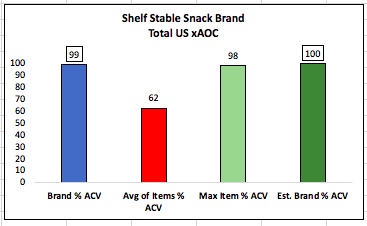
So…Brand distribution is always at least as high as the item with the highest distribution and usually higher than that.  Take a look at these real-life (but masked) examples of Brand and Item % ACV Distribution for 3 different brands.  Notice that the Brand % ACV is higher than any of the individual items for all 3 brands in different geographies.

% ACV Distribution
12 weeks ending 5/20/18

When you calculate the average % ACV of the items within a brand it will always be something less than the maximum % ACV among the items.  That’s just how the math works!

So…what should you use as the Brand % ACV?  Here are 2 options:

  1. Assume the Brand %ACV is the same as the %ACV for the max item
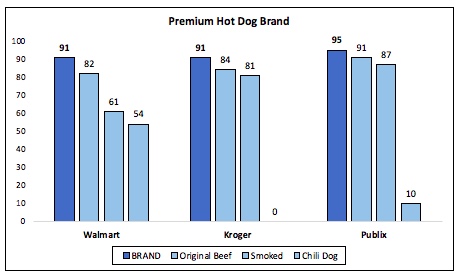
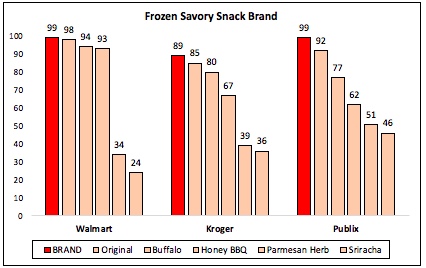
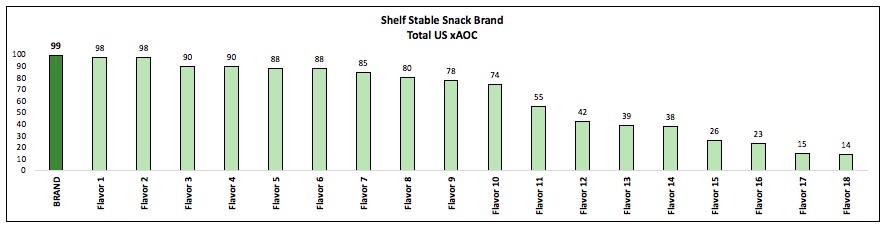
    This is the most conservative assumption but works well if there is a clear “lead” item.  In the above examples, you would be pretty darn close for the Frozen Savory Snack brand in Walmart and the Shelf Stable Snack brand in Total US xAOC – 98 vs. 99 in both cases.    The 2 examples highlighted above both have Original flavors, which are almost aways carried so it’s OK to use the % ACV for those lead items.
  2. More accurate assumption
    If you want to be more accurate, I recommend adding about 5% (not 5 points) to the max item and calling that the brand distribution.  And if that results in a number over 100, then the estimated Brand distribution is 100.  So, for the Hot Dog brand in Walmart above, a good estimate for Brand % ACV is 86 (= 82 * 1.05).  Even though this is less than the true Brand ACV of 91, it’s a lot closer than the average of the 3 items, which is 66.

Here are those results for our example brands:

In summary…the best way to estimate brand level distribution if you only have item level data is to increase the distribution of the item with the highest value a little without going over 100%.  (I recommend adding 5%.)  Unfortunately there is not a simple way to automate this for all brands in an item ranking report but it’s a straightforward way to estimate brand distribution for your brand and some key competitors.

Did you find this article useful?  Subscribe to CPG Data Tip Sheet to get future posts delivered to your email in-box. We publish articles once a month (or even less frequently). We will not share your email address with anyone.

Share
Tweet
Share

Filed Under: Know Your Measures: Distribution Tagged With: Brand % ACV, Item level data

Reader Interactions

Comments

  1. Shawn Carver says

    July 31, 2018 at 12:20 pm

    Another informative and practical article, Robin. You and Sally really do a great job with this blog!

    Reply
  2. Daryl says

    May 10, 2022 at 11:51 pm

    Hi Robin,

    Can I check if I can use the same method on PCV wtd dist? Thanks! 🙂

    Reply
    • Robin Simon says

      May 14, 2022 at 11:22 am

      I think the answer is yes, but…please clarify what PCV means. What does the P stand for? When I worked at Kraft Foods, we had a measure “AKV” which stands for All Kraft Volume, instead of All Commodity Volume. So %AKV was a measure of distribution weighted by importance to the total Kraft business, not total store business.

      Reply

Trackbacks

  1. Catman: Estimating brand distribution if you only have item level data | América Retail says:
    July 6, 2018 at 7:40 pm

    […] SimonFuenteCPG Data Tip Sheet Por América Retail: Dayana Vazquez – 6 julio, 2018 Facebook Twitter WhatsApp […]

    Reply

Leave a Reply Cancel reply

Your email address will not be published. Required fields are marked *

This site uses Akismet to reduce spam. Learn how your comment data is processed.

Primary Sidebar

Top Posts

  • The 2nd Most Important Measure: % ACV Distribution
  • Velocity: How Well Your Product REALLY Sells
  • Total Distribution Points: Master of All Distribution Measures
  • xAOC and MULO: Multi-Channel Markets in Nielsen & IRI
  • The Beginner’s Guide to Trade Merchandising Measurement

Search CPG Data Tip Sheet

Subscribe to New Posts

Get new posts delivered straight to your inbox. We won't share your email address with anyone.

Thank you for subscribing!

Subscribe

About CPG Data Tip Sheet

We (Sally Martin and Robin Simon) first met in business school and bonded over our interest in geeky marketing stuff. Eventually we both started independent consulting practices. Now we’ve reunited to share with you some of what we’ve learned in our decades of experience working with syndicated CPG data.

Categories

  • Glossary (79)
  • How To Answer Business Questions (42)
  • How To Communicate Insights (17)
  • How To Get Started with Nielsen/IRI (22)
  • How To Understand Your Database (12)
  • Know Your Measures: Distribution (24)
  • Know Your Measures: Pricing and Promotion (45)
  • Know Your Measures: Sales (21)
  • Miscellaneous (6)

Tags

ACV analysis examples analytic skills attributes average items base base weighted weeks career development category management channels characteristics coronavirus coverage factor covid-19 Database distribution due-to Excel tips Facts incremental markets Measures merchandising new items panel data periods pricing pricing strategy products promoted price quantify opportunity retailer direct data retailer markets shopper data store data Syndicated TDP the basics trade promotion trading areas velocity visualization visualizations volume bridge volume decomposition

Footer

Categories

  • Glossary (79)
  • How To Answer Business Questions (42)
  • How To Communicate Insights (17)
  • How To Get Started with Nielsen/IRI (22)
  • How To Understand Your Database (12)
  • Know Your Measures: Distribution (24)
  • Know Your Measures: Pricing and Promotion (45)
  • Know Your Measures: Sales (21)
  • Miscellaneous (6)

Search CPG Data Tip Sheet

Tags

ACV analysis examples analytic skills attributes average items base base weighted weeks career development category management channels characteristics coronavirus coverage factor covid-19 Database distribution due-to Excel tips Facts incremental markets Measures merchandising new items panel data periods pricing pricing strategy products promoted price quantify opportunity retailer direct data retailer markets shopper data store data Syndicated TDP the basics trade promotion trading areas velocity visualization visualizations volume bridge volume decomposition

Terms of Use | Copyright © 2025 CPG Data Insights · Log in