
Want to know how the heck % ACV Distribution is actually calculated? Read Part 1 here.
% ACV Distribution is a really basic measure but it can be tricky to use in analysis. Here are the 5 most important things to remember about % ACV Distribution:
- It gets triggered by a SCAN, not by whether the product is actually sitting on the shelf right this second. Just because a retailer has authorized a product, it does not mean that the product is available in all of its stores so that people can buy it. Distribution is measured by IRI/Nielsen when a product is actually scanned in a store.
- % ACV Distribution cannot be added across products, markets or periods! You must use the products, markets or periods available on your database otherwise the measure is incorrect. (You would know this quickly when distribution shows up as greater than 100%!). This is known in the biz as a non-additive fact.
- Unless your product is perishable, it is best to look at distribution for periods longer than a single week. The longer the purchase cycle for your product, the longer that period should be. For example, if people tend to buy your category only a few times per year and the product does not “expire,” it is possible that the product is in distribution but has not scanned in a week. This is highly unlikely at the Total US and market levels, but can occur at the retailer level, especially for a specific item. For most frequently-purchased products, I recommend looking at the most recent 4-week distribution and for slower-moving products the most recent 12-week.
- Be careful when looking at 52-week distribution numbers. For long periods that are aggregated from smaller chunks, distribution can be calculated as either the average or the maximum over all the weeks in the period. You can see how this does not give an accurate representation of current distribution if a product’s distribution is growing or declining, rather than relatively stable.
- Don’t be alarmed when distribution of individual items is not as high as the total brand distribution – that is normal! Distribution for a single item will almost always be lower than it is for the total brand because not all stores will carry all varieties of your product. Exceptions to this would be key items that are literally everywhere, for example white Kleenex tissues 10oz box, Kraft macaroni & cheese 7 ¼ oz, and 2-liter Diet Coke.
| Product |
% ACV Distribution |
| Honey O’s |
75 |
| Multigrain O’s |
68 |
| Apple Cinnamon O’s |
65 |
| Peanut Butter O’s |
54 |
| Chocolate O’s |
43 |
| Total O’s Brand Cereal |
81 |
Here is a question we got on this from a reader:
“Our team goes back and forth on what the correct distribution measure should be on a 52 week basis, average or max. I say average because although our products can turn slower than others, it is a more accurate measure of true distribution over 52 weeks than max, which max gets triggered if an item sells once in a 52 week period. What would you recommend we use?”
Average ACV over 52 weeks is probably the way to go for slower-moving products, but you should also look at trended months periodically, too, to see if there is a slow decline or build taking place. It may even be better to look at average for 12 weeks to capture the more recent situation. (52 week max can be dangerous because there are occasionally random scans of 1 unit of a product I know is not in distribution!) Of course if you want to show retailers how good your product is, max is fine!
Note that some clients have two different 52-week time periods on their database – one based on single weeks and one based on quad weeks. So when taking 52-week average for slower moving product, make sure you are using the quad-week based 52 week cume.
Hi Robin,
Thanks for the detailed explanation about %ACV. I am working on a project and needs some more understanding about TDP. I have %ACV and TDP for each SKU of a brand on a weekly basis for each market. These numbers I am getting directly from the Nielsen. If I need to roll up for a certain group of SKUs (and not all under the brand) and determine how good the distribution of my product was, how can I go about it? Whether TDP or ACV should be used.
Thanks in advance!
Thanks for your question!
In case you haven’t already seen it, here is our Glossary entry on Total Distribution Points (TDPs):
https://www.cpgdatainsights.com/glossary-post/tdp/
At the weekly-SKU level, %ACV Distribution = TDP. If your product level is something bigger than in individual SKU and/or the period is longer than a single week, then they will be different. The key difference is that TDP takes into account both breadth and depth of distribution – how widely the product is available AND how many items are available. % ACV Distribution only measures how widely something is available, regardless of how many items there are. Look for an upcoming post on the 3 key distribution measures, how they relate to each other and when to use each one.
Hello,
How did you obtain 81 for Total O Brand when the most distributed item is 75? Is it a O product not listed? thank you
Thanks for the question and for reading the CPG Data Tip Sheet!
The answer to your question hinges on #5 in the post. Take a look at the
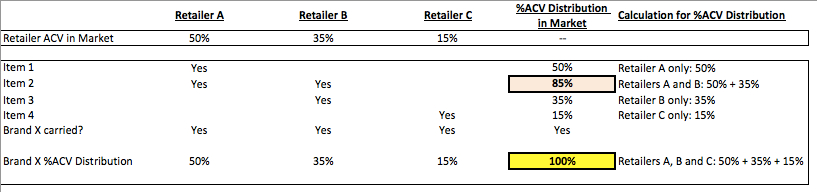
simple example below. The brand has 4 items and the market has 3 retailers.
In this case the item with highest distribution is in 85% but the Total
Brand is in 100% because each retailer carries a different combination
of items but 100% of the ACV carries the brand (at all).
Hope this helps!
This helps us understand why item #2 is 85% but still do not solve the questions related to the table in your post. Brand O’s Cereal at 81 is something we can not calculate from the table itself. There is a possibility that it can be 81 and not 75 as per your example above.
You are correct that you cannot calculate the 81% ACV for the Total O’s Brand. My response above shows how it is possible (and typical) for the Total Brand to have higher distribution than any of its individual items. In the table in the main post, the 81% is analogous to the 100% in my clarification and the 75% for item Honey is like the 85% for Item 2 in the clarification.
Great job explaining ACV .. In retail, one can get lost in acronyms 🙂
How about when you want to see what the %ACV of a total category is? Not a accumulated category, but one defined under hierarchy in Nielsen. When you pull %ACV for a category is the result accurate?
The %ACV Distribution for any product level defined in the hierarchy, including category, will be fine to use. At that high a level most categories have virtually 100% distribution since only 1 item in the category has to sell in order for the category to be in distribution. An exception to this might be a seasonal category during its off-season, for example sunscreen may have lower distribution in the winter.