
Many CPG companies purchase individual, Excel-based reports from syndicated data vendors Nielsen, IRI and SPINS. Rather than the six-figure investment required for an ongoing data subscription, individual reports can be obtained for a few thousand dollars. So it’s a great place to start with this data! The vendors are quite flexible in what can be included in these reports but you need to know what to ask for. Here are three common mistakes made by novice syndicated data buyers:
1 Ordering data on “Category X”, only to find key items missing. Take the time up front to make sure your definition of the category matches the Nielsen/IRI/SPINS definition. The vendors theoretically organize their data based on general retailer planogram norms, and sometimes the categories are perfect, but that’s not always the case. I always recommend providing Nielsen/IRI/SPINS with a list of your own brand UPC’s plus some key competitors. My clients frequently find out they must purchase multiple categories (sometimes as many as 4 or 5) to construct their perfect dataset. Bonus result of this process: Sometimes your items aren’t coded at all and now is the time to find that out and get it corrected!
2 Not asking for the right “year ago” metrics. Of course, you don’t just want to know current sales for items in your category. You also want to know whether and how much those items are growing. So you ask for current sales and % change versus year ago and now you are all set, right? Wrong. You need to ask for absolute year ago metrics, not just % change metrics. If you don’t, you’ll be missing information for items that have been discontinued. Note: for all following tables, you can click on the image for a larger view.
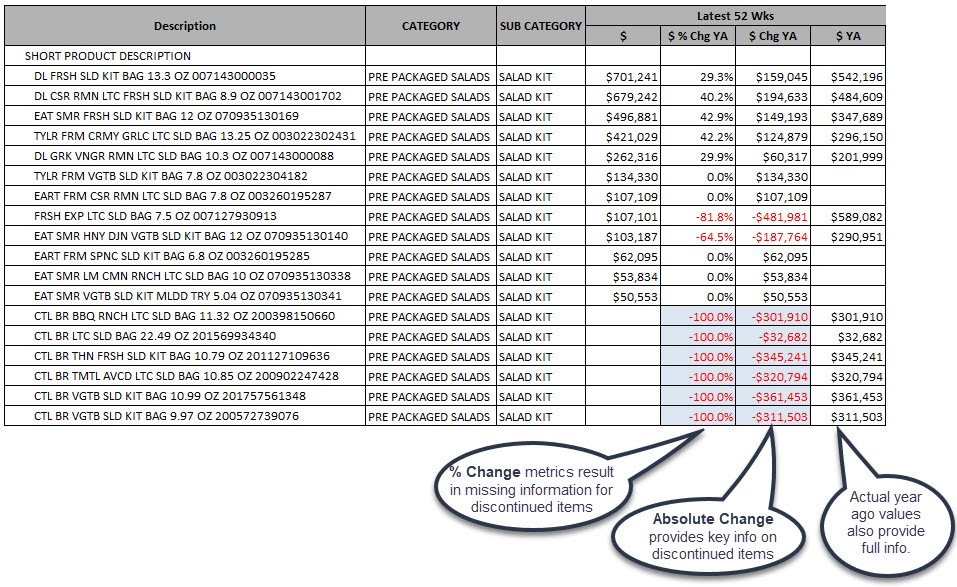 Why does this matter? Most importantly, without knowing the year-ago values at the item level, you can’t accurately calculate growth for groups of items. Plus knowing more about discontinued items (like how big they were) helps you better understand current category dynamics.
I’ve illustrated this point using the $ sales measure but this advice applies to all types of metrics (volume, distribution, promotion, price). Bottom line: Always ask for Absolute Change (Abs Change) values or the actual year ago values for every metric, in addition to % Change.
3 Failing to include important characteristics (aka attributes) for items. By default, IRI/Nielsen will provide you with category and brand and maybe a few other common attributes (sub-category for example). But, sometimes, the key attributes you need to define important product groups are not obvious. And they differ across categories. If you are purchasing a data subscription, delivered on the vendor’s software platform, you will automatically receive all characteristics/attributes. But, if you are buying an individual Excel report, you won’t. The data vendor sales rep may have to dig to figure which characteristics are relevant for you and add them to the report order. Note: I’m less familiar with characteristics and coding in SPINS but I believe these comments apply to their reports as well. Consider the below example:
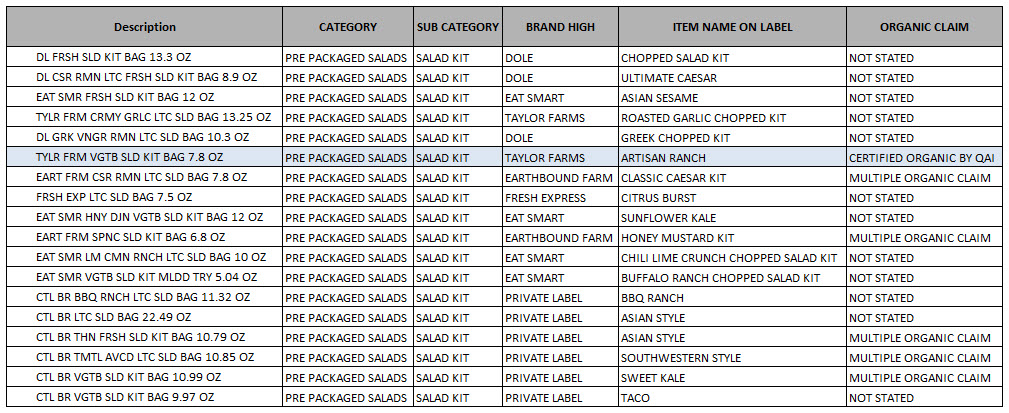
The description for these salad kits tells you very little. What if you want to separate organic kits from conventional kits? What if you want to know the flavor or texture profile of the top sellers? Take a look at the description highlighted above. You won’t know much about this product without the characteristics “Item Name On Label” and “Organic Claim”.
Here’s another example. A client had a dataset on coffee creamers. They were interested in looking more closely at plant-based creamer alternatives, a quickly growing segment. Here’s what they could see at the item level for Califa, a major plant-based brand. You can’t tell from these characteristics what plant is used! Is it almonds, soy, coconut, oat? I’m sure there is a characteristic that contains this info but it wasn’t included in this report.
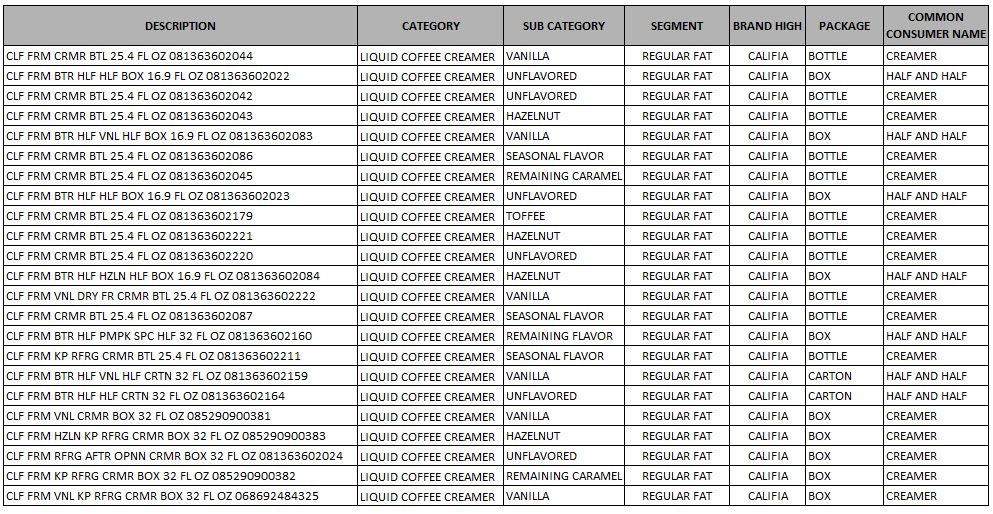
Bottom line: Think hard about what you need to know about each item and make sure you get the info you need to properly characterize each UPC.
Buying Nielsen/IRI/SPINS reports can be a great investment. Just make sure you get all the information you need to take full advantage of your purchase by:
- Carefully specifying your category
- Purchasing absolute year ago measures
- Asking for all relevant characteristics
Thank you for putting this together! Data is such a big investment – particularly for smaller brands. When I’m introducing clients to this world, I feel so much responsibility for make sure that their first investments are worth it (and convince them to continue to invest in the resource!). After thoughtfully crafting the reports you purchase, I’ve also found that it’s critical to have a guide who can help brands make sense of the data and use it to drive action within their organization. Small brands buying data for the first time often don’t have the internal expertise to create value from the reports and need to consider outside support as part of the investment. Such excellent work, as always, Sally!
I recently subscribed to your articles to learn CPG space. The articles are simple to follow and insightful. Wanted to provide the feedback that the images are of low-resolution and smaller in size which makes it harder to read.
Thanks for the feedback. We’re glad you are finding the blog helpful and will try make sure images are more readable. An image is not good if you can’t see it!
Aravind, Thanks for calling this to my attention. I’ve edited the post to make the images clickable to a larger version of the table. Hope that helps!
I’ve recently joined an emerging brand having always had the nice comfort of big CPG resources and internal knowledge to lean on. Now I’m scrapping away on my own, and am so happy to have stumbled across your website. Thank you for providing such helpful information, it’s wonderful!
Cheers.
Thank you Risa! So happy to hear our info in on target.
I am new to this and wanted to know what these reports sire. I understand it and find them very insightful. I learn quickly and this is a great marketing tool for data research and tracking sales. Thanks your site has made the information clear and easy to learn.
Trinette Finley
Thanks for putting out such insightful content. I am a Data Analyst and your content is really helping me to connect the dots and understand my data better.
So glad it’s helpful!
What if we have the dollar sales broken out by month and year and we have multiple years? Do we still need YAGO?
If you have multiple years, you don’t necessarily need year ago metrics. But I still think it’s handy to have them plus it essentially gives you an extra year of data (your year ago data for your oldest year).