
Syndicated store data from Nielsen/IRI/SPINS measures a lot about CPG sales. But not everything! If you are thinking about buying data, it’s important to clearly understand what you will and won’t get out of your purchase. Note that in this article we are talking about store data (from the POS scanner) not household panel data.
What’s explicitly measured by syndicated store data?
Most importantly, syndicated store data provides a highly accurate measure of retail sales, on both a dollar and a unit basis. Volume is also available but not automatically provided. For this purpose alone, syndicated data can be worth the money. If you are sizing a market, this is the simplest and most accurate way to get that information. You can get precise measures of sales for a single item, a brand, a category, or groups of specific types of products (e.g. a flavor, a claim, or other product attribute) for hundreds of retailers and groups of retailers.
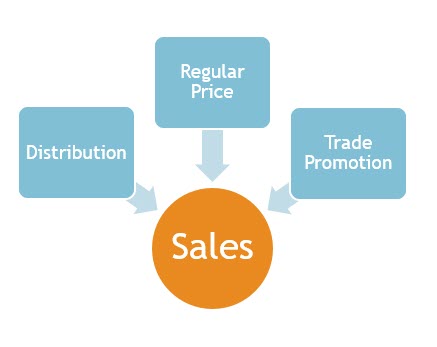
Syndicated store data also provides information on the presence of two marketing levers that are key sales drivers for every product:
Distribution: This is the #1 driver of sales – is the product available? Syndicated data “distribution” is assessed based on whether a upc scans. So it’s not true shelf availability. If you have a very slow-moving product, you need to be aware that syndicated distribution measures will not be entirely accurate. For more on how distribution is measured and what to do with that information, start here.
Retail price: Key factor #2 – what are shoppers asked to pay for your product and how does that compare to your competitors? There’s a raft of different price measures available and we have many articles in this blog explaining the differences between those measures.
Syndicated store data also provides volumes of information on another marketing driver that is a big factor for some products: trade promotion. Trade promotion is defined in a very specific way. It is either a shelf price reduction, a retailer ad, or a secondary display.
This discussion of trade promotion brings up another very important distinction in this “what is measured” discussion. For trade promotion only, there are also measures available that estimate the impact of trade promotion. In other words, not only does syndicated data give you a measure of the amount of trade promotion but also an estimate of the *extra volume sold* due to trade promotion. This is called Incremental Volume. Everything not due to trade promotion falls into another measure called Base Volume.
Trade promotion is the only driver where syndicated data provides an estimate of the impact, rather than just the presence of the driver. For example, you can find out your competitor’s everyday price from standard syndicated store data but you don’t get an estimate of how much of their volume is due to a price change. For that, you need specialized models and (often) a different, more detailed set of data. And syndicated store data will tell you the distribution achieved by your new product but you won’t get an estimate of how much of that volume was incremental to your brand. You can dig into the data and come up with your own guesstimate, based on what you see happening, or you can use other data sources (such as household panel data) to get a better handle on source of volume.
Got that? I’m going to say it again. Only for trade promotion does syndicated data have a measure that estimates the impact as well as the presence of a driver. So…don’t buy syndicated store data expecting to fully understand your price elasticity. You may get some indications, but you can’t count on it.
 What’s *not* explicitly measured by syndicated store data?
Everything that is not price, distribution or trade promotion! That leaves out a lot. And that’s why standard syndicated store data is great at showing you what happened to sales but not always as good at explaining why.
Here are just a few common factors that might be influencing your sales trends.
- Other in-store activity (sampling, Catalina coupons)
- Economic and demographic trends
- Manufacturer (as opposed to retailer) advertising and promotion
- Product quality
- Weather
- Factors like these are reflected in sales, so your syndicated data totals do capture their impact, but:
The presence of factors like these are not recorded in syndicated database. For example, there is no measure for TV advertising or in-store coupons or weather.
Databases not designed for analysis of these factors. For example, the markets and time periods between data from different sources don’t necessarily line up.
Most important to understand, the impact of many of these factors are often too small/diffuse to quantify. For example, some marketing programs reach individual households and shoppers. Store data, which adds up sales from everyone who shops in a particular store in a particular week, can be a very poor tool for assessing shopper specific programs. There are so many transactions that are not influenced by the marketing activity (which just hit certain shoppers) that the impact is impossible to see at the store level.
Syndicated store data can often used as an input to sophisticated analysis, often involving statistical models, which can help you quantify some of the other factors listed here. But, if you are on a limited budget of dollars and time, it’s important to understand the limitations of an out-of-the-box syndicated store data purchase.
Hi Sally,
As a small-medium CPG company, I’m still not convinced our team needs to subscribe to retailer direct data in addition to our syndicated subscriptions. Do you have a resource or article that takes a deeper dive into this topic?
Thank you,
Bob
Dear Bob,
We don’t have an article on this topic, though it’s a good one! I also don’t know of any outside publications that cover it. There might be specific retailers where it would make sense to subscribe and others where you could take a pass. I would say there are three main reasons you would subscribe to retailer direct data for accounts where you already have syndicated data.
Also, using retailer direct data might make sense for accounts that aren’t available from your syndicated supplier (e.g. Kroger if you data vendor is Nielsen or Whole Foods if your supplier is IRI). You might find the retailer direct data is sufficient, rather than having to engage with the other syndicated data vendor. And of course some retailers don’t work with either third party vendor so retailer direct data would be your only possible source of information.
Thank you, Sally – I very much appreciate the response!
You are welcome! And in the meantime, I thought of two more situations where retailer direct data can enhance syndicated: 1) If you find Nielsen/IRI do not code certain items, you can fall back on retailer direct data. This happened with one of my clients. We did get the items coded but that process took a while and were happy to have the retailer direct data as an immediate back up. 2) There are some retailers who do not supply private label information to Nielsen/IRI. CVS is an example of this. So you still might buy syndicated CVS data but the retailer POS data is the only way to get a true total number for the category.
Hello, just a quick question. Could you tell me the main diferences between Nielsen and IRI?
The underlying data is similar. They each have some different exclusive relationships with retailers or other data partners. At any given point in time, they might differ in their strategies or where they are focusing. It’s best to get information/proposals from both of them because the subtle differences might or might not make a difference to you, depending on your priorities. They are both strong companies with quality products and services – one is not better than the other.
Regarding scans and distribution, is it published or common knowledge what the lag time is for syndicated POS data? I’ve heard 6 weeks delay, but wondering if this is accurate and/or consistent.
If you are asking about Nielsen/IRI POS data…the lag time depends on a few things. If you receive data once a month (probably the most common frequency), then the data is available to you about 9 days after the end of the last week in the period. For example: for the March period ending 3/27/20 (Nielsen period ending on Saturday), data would be available for all 4 weeks in that period on Monday, 4/6. As a reminder, IRI periods end on Sunday so the corresponding lag would be period ending 3/28/20 is usually available on 4/7/20. For clients that get weekly data, it’s the same lag time but new data is available every week. Hope that helps!
Hi Sally – I’m curious, why do the retailers provide point of sale data to IRI or Nielsen? What do they get in return for this data?
In case you haven’t seen this post, take a look to get an understanding of retailer-specific vs. syndicated data. As you can see, the only way that retailers can tell how they are doing vs. other retailers is with syndicated data (i.e. sold by Nielsen, IRI, etc.). As far as I know, retailers do not get paid by those suppliers but instead receive some analysis and also enable their manufacturer trading partners to share very informative data about their retail competitive landscape. Hope that helps!
Hi Robin/Sally,
Thanks for a wonderful article. I have a question based on the article. Why is price elasticity not the right metric that can be calculated from Syndicated data source ? We can see how the actual Non-Promo price has changed across weeks /months and can’t we use that to calculate the price impact on sales ?
Thanks.
Since syndicated data is market level, not store level, it’s averaging together prices from many different stores. You don’t know what price change the consumer is actually reacting to – you don’t see that real individual shelf price change – you only see the average of all the price changes at all the stores in the syndicated market. Therefore, using that average market level price change can lead to an inaccurate elasticity estimate.
Now if you are looking at the retail account level and you know that this retailer does not have price zones and has exactly the same prices in every store, then maybe you are fine using syndicated data at the retailer level to estimate a price elasticity for that retailer. Because the price change you see for the total account will be the same as the price change that is happening in each individual store. But that would not be true for any market that combines retailers and would not be true for any retailer that has different prices in different stores.
Also, you mentioned non-promoted price so I wanted to make sure you had seen this article (on why non-promoted price can be misleading and base price can be a better measure to use):
https://www.cpgdatainsights.com/pricing-and-promotion/never-look-at-non-promoted-price/
Thanks Sally. This is awesome reply and has potential to be a post in itself !