
 CPG Data Tip Sheet focuses on education and best practices for analyzing syndicated retail sales data from IRI and Nielsen (and SPINS for those of you in the Natural/Organic sector). But syndicated data is not the only type of CPG data you’ll encounter. In fact, it’s not even the only type of retail sales data! This post takes a step back to describe where syndicated data fits in to the bigger CPG data picture. Understanding this will help you:
- Determine which data source you should use to answer different questions
- Understand the strengths and weaknesses of each data source (and how that might impact your analysis) and
- Decide whether syndicated data is something you need in your data arsenal (and budget)
The Benefits of Retail Sales Data
Syndicated data is one type of retail sales data. I’ll talk below about the differences between syndicated and retailer direct data, which is another major type. But first, let’s cover some of the special qualities of all retail sales data.
Not everyone needs retail data to measure sales. CPG manufacturers already know exactly what they shipped to each retailer and when. So why are CPG manufacturers the primary buyers of retail sales data? Because shipments are distant from consumer behavior—a lot can happen in the time between when a product is shipped from a plant and bought at a store. Shipments don’t tell you what price a shopper paid, when they bought or what type of in-store conditions influenced the sale. For that, you need retail sales level information, which is also called “consumption data.” Other terms for it are takeaway, off-take, downstream and POS data.
Retail sales data also provides insights not available through market research methods such as consumer surveys. CPG manufacturers can gather valuable data through survey research. They segment buyers into different groups based on attitude, ask buyers about their product feature preferences, test their responses to different package graphics, and much more. But retail sales data is different from all these sources of consumer insight because it reflects actual behavior. It measures not what people think or feel, but rather what they purchased at a particular moment in a particular store under a particular set of market and competitive conditions.
The Retail Sales Data Landscape
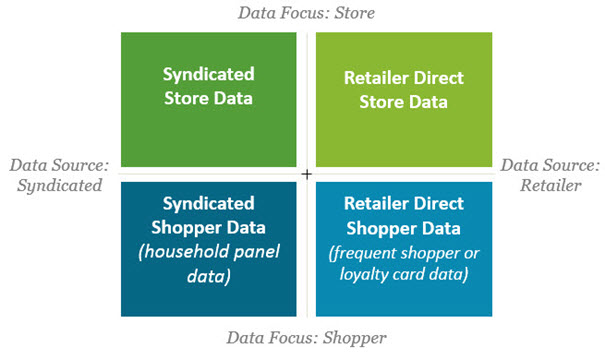
It helps to know that all retail sales data can be divided into four buckets, based on a combination of two parameters.
- Data Source: Did it come directly from the retailer (like Walmart or Meijer) and therefore reflects only sales for that retailer? Or did it come through a syndicated vendor (like IRI or Nielsen) which pools data from many retailers to create a picture of the total market?
- Data Focus: Is the data focused on store level sales, combining the transactions of all individual shoppers? Or is the data giving you insights on individual behavior at the shopper or household level?
The graphic below illustrates how these parameters combine to create four types of retail sales data.
Here are the key differences between each of the four types of retail sales data:
Syndicated Store Data
- Best applications: general learning on sales trends, competitive analysis, distribution, price, and trade promotion.
- Available from Nielsen, IRI, and SPINS for most major retailers in the Food, Drug, Dollar, Mass, Convenience, Club and Military channels.
- Data available on hundreds of markets across hundreds of categories for all UPC’s in the category. Consistency allows easy comparison across products, retailers, and markets.
Retailer Direct Store Data
- Best applications: retailer collaboration, category and supply chain management. It’s the retailers’ actual data, organized the way they want to see it.
- Available from many retailers, large and small.
- Data availability and format varies.
- Data will never include competitive retailers and often won’t cover full category, only your own products
Syndicated Panel Data
- Best applications: understanding buyer behaviors such as store and brand loyalty, share of wallet, cross-purchasing, channel-shifting, demographics and purchase frequency
- Available from Nielsen, IRI, and SPINS for demographically balanced sample of 120,000 households who scan UPC coded purchases in-home.
- Provides a complete picture of household buying behavior across all retailers, even those who don’t provide store data to the vendors. However, sample size can be an issue for some products with low penetration.
Retailer Direct Panel Data
- Best applications: understanding buyer behaviors such as basket size, trips, purchase frequency, and cross-purchasing at a particular retailer
- Available only from large retailers.
- Sample sizes will not be an issue for most products but behavioral picture is incomplete and questions like loyalty and share of wallet cannot be addressed since there is no information about what shoppers are doing outside of that retailer.
Read more about retailer direct vs. syndicated data here. Read more about store data vs. panel data here and here.
Looking for training on this topic? I recommend Category Management Knowledge Group’s online class Understanding and Using Data. If you already know the basics, check out their Building Data Competency courses. There is one on store data and one on panel data.
Very helpful. I look forward to learning more from this site.
Thank you.
Can you please provide me with the IRI contact detail, phone, e-mail, etc.
The best contact information would be available on their website.
Well explained. Thanks 🙂
I heard Nielsen and IRI parted ways (not sure when). In regards to Nielsen services, what is Homescan and how is it different from IRI/Nielsen when the two were together in terms of syndicated retail data?
IRI and Nielsen have always been separate companies (and bitter rivals in my experience as an IRI employee in the 1990’s). In 2009, however, they agreed to a joint venture, called the National Consumer Panel (NCP), which would gather detailed transaction data from over 100,000 households. NCP is run as a completely separate and independent company. Nielsen’s Homescan service is based on the NCP data. IRI has a comparable service called Consumer Network that also draws from NCP data. If you would like to know more about the types of information available in panel data from Nielsen or IRI, see my articles elsewhere in this blog: Household Panel: The Other Data and What’s Your Data Focus? Retail Store Data or Shopper Panel Data?
Hi
What is the difference between Major Brands, Brands and Sub-Brands?
That is somewhat arbitrary. The definition might differ from one manufacturer to another. Those different levels just give you a way to group products in a fashion that is meaningful for you. Generally, that should have something to do with the way consumers might perceive things as different brands. I think this is a good question for a blog post – if/when I write that post, I’ll link it here.
Thanks Sally. Well explained.
Another great option for category management training is Learning Evolution. http://shoppersciencestraining.com/category-management-training