One of our readers in the UK asked the following question after my recent posting on the different sales measures:
“How can I calculate equivalized sales? If there is a formula for that, can you please send it to me?”
If you have a custom database, then you probably already have EQ sales as a measure, so you don’t have to calculate it yourself (or read the rest of this post).
In terms of actually calculating EQ sales, it is feasible to do it for your own business but gets complex pretty quickly to do it for an entire category. At the item level, you need to know the size of each item and the unit sales. Common EQ unit measures are ounces, pounds, gallons, cases, etc. (In other countries it can be kg, ml, etc.).
Manual Method
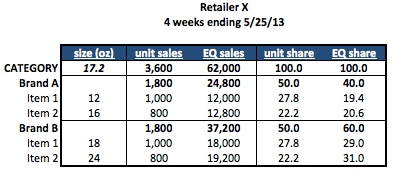
Here is a very simple example: Let’s say a category is made up of only two brands, A and B, each with two items. Assume that the equivalized unit measure for this category is ounces.

- At the item level, EQ sales = unit size * unit sales [Note: If the equivalized unit measure you want is pounds but the size attribute in the database is ounces, then the calculation for EQ sales at the item level would be unit size * unit sales / 16.]
- At the brand level, EQ sales = sum of EQ sales for all items in the brand
- At the category level, EQ sales = sum of EQ sales for all brands in the category
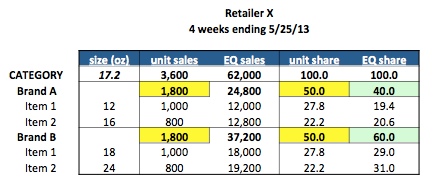
Even though both brands have the same unit sales (1,800) and unit share (50.0), Brand B has higher EQ sales and EQ share because of its bigger package sizes. This is why it’s important to look at EQ sales if you can – it leads you to different conclusions.

As a bonus for you, I also calculated the average unit size for the category: EQ sales / unit sales, which is 17.2 oz. (Don’t say I never gave you anything!)
Since most databases have “size” as an attribute or characteristic in the product dimension, technically it is possible to calculate EQ if it is not already a fact on your database. But you can see why you probably do not want to do this at the category level on an on-going basis – this gets complex very quickly! If you have a syndicated DB, you may not even be able to use this “tedious” method to calculate EQ sales. That’s because not all IRI/Nielsen product modules have the same EQ unit measure. Some may use ounces, others use count, still others may use pounds. If your category definition cuts across multiple product modules, then be sure to check and see what the EQ measures are before calculating EQ sales manually. Just like you usually do not want to add together apples and oranges, you don’t want to add together ounces and pounds. In both cases you may be physically able to do so, but the result doesn’t necessarily make sense.
Workaround If Category Cuts Across Product Modules
If you do not have EQ on your custom database or if the EQ measure is not usable, then you could at least get an idea of why unit sales are changing: due to a change in the mix of package sizes or due to a real change in product sales. You could create some custom product aggregates based on package size and then see what the growth rates are of different size groups. I recommend grouping package sizes into small, medium and large rather than having a subtotal for every individual size available in the category. This will enable you to see if positive unit sales trends are a result of shoppers truly buying more product or just buying more, smaller packages. Check with your Nielsen/IRI client service rep for help creating custom product totals.
Did you find this article useful? Subscribe to CPG Data Tip Sheet to get future posts delivered to your email in-box. We publish articles once a month. We will not share your email address with anyone.

The EQ volume includes the volume on price reduced and promoted sales? Thank you!
It depends what you pulled or calculated! EQ volume for Total sales (promoted and non-promoted together) is usually available in most databases or you can calculate it as described in this post. You can also get to it for sales with all the different merchandising conditions if those are available in your database. Hope that helps!
How do you calculate Avg EQ Price?
Avg EQ Price = Total Dollar sales / EQ Sales, but it is also usually a measure that is directly available on most databases. See this post on pricing that includes some watch-outs when looking at average price.
I am being asked if shoppers are buying smaller pack sizes more frequently due to lower absolute price point or larger packs less often due to better price/ounce, in a certain category for Total US. I created two buckets, one more than 6 ounces and one less than.
However, if I look at $ velocity ($ per $MM ACV), the larger group is selling faster/more due to its higher price. If I look at U velocity (U per $MM ACV), the smaller group is selling more/faster.
Is a true picture? Would looking at it by EQ (or Volume, in IRI) be a more true way to see what is happening?
Thank you so much!
It seems like the question is trying to get at the interaction between small and large sizes within a category. When the phrase “more frequently” appears, then the true source to get at that is panel (not POS) data. POS data can tell what is selling faster (velocity) but that could be due to increased frequency, increased purchase size or both. Assuming adequate sample size, which there probably would be for the small vs. large size aggregates at the category level, look at frequency (item trips per buyer) and purchase size (EQ per trip per buyer). See this post for more on the key measures in panel data ans this one on the differences between panel and POS data.
If you don’t have panel data then you could look at EQ velocity to see how fast total “physical product” of each size group is moving. The other thing to do is compare % chg vs. year ago in pricing and velocity for both size groups. Please contact us if you want to discuss that in more detail. In any case I like that you trying to figure out what is happening in real life to case the sales to look the way they do!