• Skip to primary navigation
  • Skip to main content
  • Skip to primary sidebar
  • Skip to footer

CPG Data Tip Sheet

Transforming your syndicated data into business insight

  • Home
  • Glossary
  • About Robin Simon
  • About Sally Martin
  • Contact
Blog » volume decomposition

volume decomposition

Featured Article

Thank You, Readers on Our 10th Anniversary!...

Robin Simon

Miscellaneous

Featured Article

20 Golden Rules to Help You Shine As An Analyst

Sally Martin

How To Answer Business Questions

Featured Article

Visualization: A Picture Is Worth A Thousand Numbers...

Robin Simon

How To Communicate Insights

Featured Article

Syndicated Retail Sales Data 101...

Sally Martin

How To Get Started with Nielsen/IRI

Volume Decomposition Using Panel Data: Why Are Sales Up or Down?

April 30, 2025 By Robin Simon Leave a Comment

Many people are familiar with the analysis known as a volume decomposition (or due-to) that uses POS data.  This allows you to explain a change in sales and attribute gains and losses to specific business drivers like distribution, pricing, trade promotion and some other things.  We have a series of posts on this, starting with […]

Filed Under: How To Answer Business Questions Tagged With: due-to, panel data, volume decomposition

Volume Decomposition, Part 6 of 6: Impact of All Other Drivers (aka “Everything Else”)

March 30, 2017 By Robin Simon 10 Comments

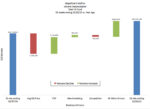
This is the sixth and final post in my series on quantifying the impact of business drivers on sales volume. The first post in the series explains more about when you would want to do an analysis like this.  A volume decomposition analysis allows you to explain why your volume changed by allocating the total […]

Filed Under: How To Answer Business Questions Tagged With: business drivers, due-to, volume decomposition

Volume Decomposition, Part 5 of 6: Impact of Competition

February 24, 2017 By Robin Simon 7 Comments

This is the fifth in a series of posts on quantifying the impact of business drivers on sales volume.  Please review these posts first to get more context: Part 1 – Overview of this very useful analytical technique that helps answer the question Why did our volume change? Part 2 – Impact of Distribution Part […]

Filed Under: How To Answer Business Questions Tagged With: due-to, quantify competition volume impact, volume bridge, volume decomposition

Volume Decomposition, Part 4 of 6: Impact of Merchandising

July 25, 2016 By Robin Simon 10 Comments

This is the fourth in a series of posts on quantifying the impact of business drivers on sales volume.  Please review these posts first to get more context: Part 1 – Overview of this very useful analytical technique that helps answer the question Why did our volume change? Part 2 – Impact of Distribution Part […]

Filed Under: How To Answer Business Questions Tagged With: due-to, merchandising impact, volume decomposition

Volume Decomposition, Part 1 of 6: Why Are Sales Up (or Down)?

January 26, 2016 By Robin Simon 30 Comments

Has this happened to you?  Sales of your brand are down vs. the same period last year and management wants to know why.  Sales is saying it’s because there is less advertising this year but Marketing is saying it’s because you’ve lost distribution and the retail price and merchandising are not as competitive.  Another, more […]

Filed Under: How To Answer Business Questions, How To Communicate Insights Tagged With: due-to, volume bridge, volume decomposition

Elasticity

July 1, 2012 By Robin Simon 8 Comments

Elasticity is a key concept when determining how much a change in a business driver results in a change in volume.  For simplicity, you multiply the % change in the driver times the elasticity to get the % change in volume.  (The formula for applying elasticity can be more complex, especially for pricing, but this […]

Filed Under: Glossary, How To Answer Business Questions Tagged With: due-to, volume decomposition, volume impact

Primary Sidebar

Top Posts

  • The 2nd Most Important Measure: % ACV Distribution
  • Velocity: How Well Your Product REALLY Sells
  • Total Distribution Points: Master of All Distribution Measures
  • xAOC and MULO: Multi-Channel Markets in Nielsen & IRI
  • The Beginner’s Guide to Trade Merchandising Measurement

Search CPG Data Tip Sheet

Subscribe to New Posts

Get new posts delivered straight to your inbox. We won't share your email address with anyone.

Thank you for subscribing!

Subscribe

About CPG Data Tip Sheet

We (Sally Martin and Robin Simon) first met in business school and bonded over our interest in geeky marketing stuff. Eventually we both started independent consulting practices. Now we’ve reunited to share with you some of what we’ve learned in our decades of experience working with syndicated CPG data.

Categories

  • Glossary (79)
  • How To Answer Business Questions (42)
  • How To Communicate Insights (17)
  • How To Get Started with Nielsen/IRI (22)
  • How To Understand Your Database (12)
  • Know Your Measures: Distribution (24)
  • Know Your Measures: Pricing and Promotion (45)
  • Know Your Measures: Sales (21)
  • Miscellaneous (6)

Tags

ACV analysis examples analytic skills attributes average items base base weighted weeks career development category management channels characteristics coronavirus coverage factor covid-19 Database distribution due-to Excel tips Facts incremental markets Measures merchandising new items panel data periods pricing pricing strategy products promoted price quantify opportunity retailer direct data retailer markets shopper data store data Syndicated TDP the basics trade promotion trading areas velocity visualization visualizations volume bridge volume decomposition

Footer

Categories

  • Glossary (79)
  • How To Answer Business Questions (42)
  • How To Communicate Insights (17)
  • How To Get Started with Nielsen/IRI (22)
  • How To Understand Your Database (12)
  • Know Your Measures: Distribution (24)
  • Know Your Measures: Pricing and Promotion (45)
  • Know Your Measures: Sales (21)
  • Miscellaneous (6)

Search CPG Data Tip Sheet

Tags

ACV analysis examples analytic skills attributes average items base base weighted weeks career development category management channels characteristics coronavirus coverage factor covid-19 Database distribution due-to Excel tips Facts incremental markets Measures merchandising new items panel data periods pricing pricing strategy products promoted price quantify opportunity retailer direct data retailer markets shopper data store data Syndicated TDP the basics trade promotion trading areas velocity visualization visualizations volume bridge volume decomposition

Terms of Use | Copyright © 2025 CPG Data Insights · Log in