• Skip to primary navigation
  • Skip to main content
  • Skip to primary sidebar
  • Skip to footer

CPG Data Tip Sheet

Transforming your syndicated data into business insight

  • Home
  • Glossary
  • About Robin Simon
  • About Sally Martin
  • Contact
Blog » How To Understand Your Database » How To Estimate Retailer ACV Using Nielsen or IRI Data

How To Estimate Retailer ACV Using Nielsen or IRI Data

July 8, 2013 By Sally Martin 6 Comments

Print Friendly, PDF & Email

Sometimes you want to know total ACV for a retailer (in other words, not just how much they’re selling in your category, but how much they’re selling in the entire store). You need this number to assess trading area trends or to find out whether the retailer is getting their fair share of sales for your category. But what if you don’t have this measure? Not all databases include it and you won’t automatically get it in an ad hoc Excel report.  Fortunately, you can estimate it yourself.

To do so, you need data for a product level that is always available with 100% distribution. Usually this criteria will apply to your category total – there is probably at least one item that sells in that category every day of every week.  But if you don’t have a product level that is always available 100% of the time (or something very close to it) stop now because your calculation will understate ACV.

Assuming you have that product line with consistent distribution of 100%, grab:

  1. Dollars
  2. Dollars per $MM ACV (or “Dollars per Million”)

“Dollars per Million” holds the key to calculating ACV because ACV is the behind-the-scenes denominator. Therefore:

Retailer ACV = (Dollars / Dollars per million) * 1,000,000

Typically, you’d use a time period of 52 weeks because most of the time you’re using the ACV to quantify annual opportunities. But the calculation can work regardless of the time period selected.

If you purchased an Excel report with a shorter time period (say 13 weeks), use the calculation above but multiply ACV by four to get to an annual estimate.

What if you use the 52-week values from your database to do the calculation but your ACV estimate looks way too low? In some databases, 52-week values are aggregated from 1- week values or 4-week values. If this is true for you, you’ll need to multiple your results by either 52 or 13 to get an annualized number.

Here’s a real example using a recent 4-week period for a nearly $2 billion dollar retailer.

Calculate Retailer ACV revised

Did you find this article useful? Subscribe to CPG Data Tip Sheet to get future posts delivered to your email in-box. We publish articles twice a month. We will not share your email address with anyone.

Share8
Tweet
Share

Filed Under: How To Understand Your Database, Know Your Measures: Sales Tagged With: ACV

Reader Interactions

Comments

  1. Todd Brekke says

    July 10, 2015 at 2:23 pm

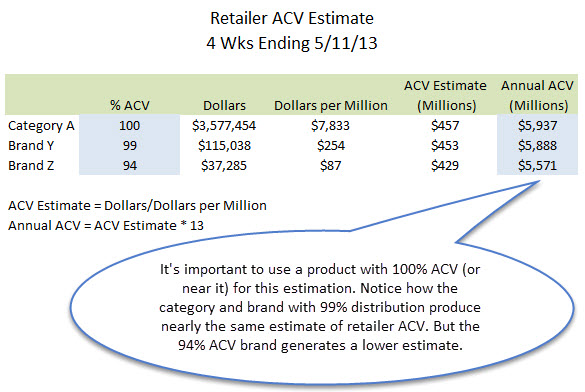
    Appreciate this info. Really helps to deepen the understanding of this metric and its usefulness. One small glitch, however. It looks like the Annual ACV in the above example table is calculated using the ACV Estimate * 4 vs. *13 as indicated in the footnote definition.

    Reply
    • Sally Martin says

      July 12, 2015 at 5:03 pm

      Thank you for your careful reading! I’ve fixed that error now in the original post. I appreciate you calling it to my attention.

      Reply
  2. Amit says

    October 25, 2016 at 2:32 pm

    Very useful info. In case there is no product with 100% ACV, can %ACV be used to make the Annual ACV more accurate by adjusting the formula for ACV estimate as follows: Dollars/(Dollars per Million * %ACV).
    e.g. for brand Y:
    ACV Estimate = 115038 / (254 * 0.99) = 457.48

    Reply
    • Sally Martin says

      October 30, 2016 at 10:12 pm

      If it’s close to 100%, this will be fine to do. But if it’s not close, if it’s for example 75%, then you are assuming the part of the distribution you are missing is just like the part you have. So I wouldn’t do it – you can get misleading results if that’s not a fair assumption. Another thing you can do is find estimates of total retailer sales in the trade press. I’ve found they usually line up pretty well with the numbers I get using this method.

      Reply
  3. Angel Antonio Bernardy says

    August 25, 2019 at 9:07 pm

    I don’t have dollars per million on my IRI report. How can I calculate it?

    Reply
    • Sally Martin says

      August 29, 2019 at 3:42 pm

      Unfortunately, you can’t. If you don’t have market ACV and you don’t have $/mm, you won’t be able to do what I did in this post.

      Reply

Leave a Reply Cancel reply

Your email address will not be published. Required fields are marked *

This site uses Akismet to reduce spam. Learn how your comment data is processed.

Primary Sidebar

Top Posts

  • The 2nd Most Important Measure: % ACV Distribution
  • Velocity: How Well Your Product REALLY Sells
  • Total Distribution Points: Master of All Distribution Measures
  • xAOC and MULO: Multi-Channel Markets in Nielsen & IRI
  • The Beginner’s Guide to Trade Merchandising Measurement

Search CPG Data Tip Sheet

Subscribe to New Posts

Get new posts delivered straight to your inbox. We won't share your email address with anyone.

Thank you for subscribing!

Subscribe

About CPG Data Tip Sheet

We (Sally Martin and Robin Simon) first met in business school and bonded over our interest in geeky marketing stuff. Eventually we both started independent consulting practices. Now we’ve reunited to share with you some of what we’ve learned in our decades of experience working with syndicated CPG data.

Categories

  • Glossary (79)
  • How To Answer Business Questions (42)
  • How To Communicate Insights (17)
  • How To Get Started with Nielsen/IRI (22)
  • How To Understand Your Database (12)
  • Know Your Measures: Distribution (24)
  • Know Your Measures: Pricing and Promotion (45)
  • Know Your Measures: Sales (21)
  • Miscellaneous (6)

Tags

ACV analysis examples analytic skills attributes average items base base weighted weeks career development category management channels characteristics coronavirus coverage factor covid-19 Database distribution due-to Excel tips Facts incremental markets Measures merchandising new items panel data periods pricing pricing strategy products promoted price quantify opportunity retailer direct data retailer markets shopper data store data Syndicated TDP the basics trade promotion trading areas velocity visualization visualizations volume bridge volume decomposition

Footer

Categories

  • Glossary (79)
  • How To Answer Business Questions (42)
  • How To Communicate Insights (17)
  • How To Get Started with Nielsen/IRI (22)
  • How To Understand Your Database (12)
  • Know Your Measures: Distribution (24)
  • Know Your Measures: Pricing and Promotion (45)
  • Know Your Measures: Sales (21)
  • Miscellaneous (6)

Search CPG Data Tip Sheet

Tags

ACV analysis examples analytic skills attributes average items base base weighted weeks career development category management channels characteristics coronavirus coverage factor covid-19 Database distribution due-to Excel tips Facts incremental markets Measures merchandising new items panel data periods pricing pricing strategy products promoted price quantify opportunity retailer direct data retailer markets shopper data store data Syndicated TDP the basics trade promotion trading areas velocity visualization visualizations volume bridge volume decomposition

Terms of Use | Copyright © 2025 CPG Data Insights · Log in