• Skip to primary navigation
  • Skip to main content
  • Skip to primary sidebar
  • Skip to footer

CPG Data Tip Sheet

Transforming your syndicated data into business insight

  • Home
  • Glossary
  • About Robin Simon
  • About Sally Martin
  • Contact
Blog » How To Communicate Insights » Page 2

How To Communicate Insights

Featured Article

Thank You, Readers on Our 10th Anniversary!...

Robin Simon

Miscellaneous

Featured Article

20 Golden Rules to Help You Shine As An Analyst

Sally Martin

How To Answer Business Questions

Featured Article

Visualization: A Picture Is Worth A Thousand Numbers...

Robin Simon

How To Communicate Insights

Featured Article

Syndicated Retail Sales Data 101...

Sally Martin

How To Get Started with Nielsen/IRI

Volume Decomposition, Part 1 of 6: Why Are Sales Up (or Down)?

January 26, 2016 By Robin Simon 30 Comments

Print Friendly, PDF & Email

Has this happened to you?  Sales of your brand are down vs. the same period last year and management wants to know why.  Sales is saying it’s because there is less advertising this year but Marketing is saying it’s because you’ve lost distribution and the retail price and merchandising are not as competitive.  Another, more […]

Filed Under: How To Answer Business Questions, How To Communicate Insights Tagged With: due-to, volume bridge, volume decomposition

How to Be a Great Data Analyst

November 2, 2015 By Sally Martin 14 Comments

Print Friendly, PDF & Email

Despite the promise of software vendors that their “methodologies extract meaningful and actionable insights from Big Data,” my experience is that no methodology can substitute for the human brain of an astute analyst. Great data analysts are a rare and valuable commodity. So what makes for a great one? They know the data inside and […]

Filed Under: How To Answer Business Questions, How To Communicate Insights Tagged With: analytic skills, career development

Ugly Duckling to Beautiful Swan

Excel VLOOKUP: Transform Your Product Descriptions from Ugly Ducklings to Beautiful Swans

March 3, 2014 By Sally Martin 1 Comment

Print Friendly, PDF & Email

For many years, I used Excel and never knew about VLOOKUP. Oh, the hours I wasted! I’m writing this post to save you from the same sad, productivity-sapping fate. What is VLOOKUP? It’s a simple Excel function that allows you to pull information from one data set to another, based on some matching value. While […]

Filed Under: How To Communicate Insights Tagged With: Excel tips

Picture This: Time After Time, The Line Chart

February 16, 2014 By Robin Simon

Print Friendly, PDF & Email

One of the most powerful graphs is the line chart.  Line charts allow you to: Decode underlying trends over time Compare trends for different products or markets Explore relationships  between different measures In addition to making it easier to see trends, you will typically use a line graph because there’s just too much data to […]

Filed Under: How To Communicate Insights Tagged With: line chart, trend chart, visualization

Picture This: Bar Chart, The Go-To Graph

January 19, 2014 By Robin Simon Leave a Comment

Print Friendly, PDF & Email

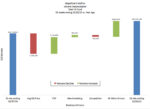
The bar chart is probably the most commonly used type of graph and this post talks about what kind of data this works well for.  In this post I’ll  talk about using bar charts to compare various products and geographies but for one fact and one time period.  This is part of a series of […]

Filed Under: How To Communicate Insights Tagged With: bar chart, visualization

Picture This: Famous Movie Quotes!

January 18, 2014 By Robin Simon 2 Comments

Print Friendly, PDF & Email

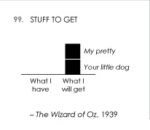
Here’s something fun that I came across this week, as movies were in the news due to the announcement of Oscar nominations: Click here to see Famous Movie Quotes as Charts, from the website Flowingdata.com (January 16, 2014).  Note the wide variety of graph types used! This shows that you don’t have to have numerical data […]

Filed Under: How To Communicate Insights Tagged With: visualization

  • « Go to Previous Page
  • Page 1
  • Page 2
  • Page 3
  • Go to Next Page »

Primary Sidebar

Top Posts

  • The 2nd Most Important Measure: % ACV Distribution
  • Velocity: How Well Your Product REALLY Sells
  • Total Distribution Points: Master of All Distribution Measures
  • xAOC and MULO: Multi-Channel Markets in Nielsen & IRI
  • The Beginner’s Guide to Trade Merchandising Measurement

Search CPG Data Tip Sheet

Subscribe to New Posts

Get new posts delivered straight to your inbox. We won't share your email address with anyone.

Thank you for subscribing!

Subscribe

About CPG Data Tip Sheet

We (Sally Martin and Robin Simon) first met in business school and bonded over our interest in geeky marketing stuff. Eventually we both started independent consulting practices. Now we’ve reunited to share with you some of what we’ve learned in our decades of experience working with syndicated CPG data.

Categories

  • Glossary (79)
  • How To Answer Business Questions (42)
  • How To Communicate Insights (17)
  • How To Get Started with Nielsen/IRI (22)
  • How To Understand Your Database (12)
  • Know Your Measures: Distribution (24)
  • Know Your Measures: Pricing and Promotion (45)
  • Know Your Measures: Sales (21)
  • Miscellaneous (6)

Tags

ACV analysis examples analytic skills attributes average items base base weighted weeks career development category management channels characteristics coronavirus coverage factor covid-19 Database distribution due-to Excel tips Facts incremental markets Measures merchandising new items panel data periods pricing pricing strategy products promoted price quantify opportunity retailer direct data retailer markets shopper data store data Syndicated TDP the basics trade promotion trading areas velocity visualization visualizations volume bridge volume decomposition

Footer

Categories

  • Glossary (79)
  • How To Answer Business Questions (42)
  • How To Communicate Insights (17)
  • How To Get Started with Nielsen/IRI (22)
  • How To Understand Your Database (12)
  • Know Your Measures: Distribution (24)
  • Know Your Measures: Pricing and Promotion (45)
  • Know Your Measures: Sales (21)
  • Miscellaneous (6)

Search CPG Data Tip Sheet

Tags

ACV analysis examples analytic skills attributes average items base base weighted weeks career development category management channels characteristics coronavirus coverage factor covid-19 Database distribution due-to Excel tips Facts incremental markets Measures merchandising new items panel data periods pricing pricing strategy products promoted price quantify opportunity retailer direct data retailer markets shopper data store data Syndicated TDP the basics trade promotion trading areas velocity visualization visualizations volume bridge volume decomposition

Terms of Use | Copyright © 2026 CPG Data Insights · Log in