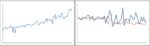
One of the most powerful graphs is the line chart. Line charts allow you to: Decode underlying trends over time Compare trends for different products or markets Explore relationships between different measures In addition to making it easier to see trends, you will typically use a line graph because there’s just too much data to […]