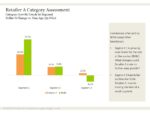

Over the last year, we’ve written lots of articles showing you how to use key IRI/Nielsen measures. In this post, I’ll pull together several of those lessons in a step-by-step mini case study. The goal of this analysis is a common one: convince a retailer to increase the number of varieties for our target […]
How To Answer Business Questions
The Case of the Mismatched Volume: Comparing Shipments and Retail Sales
A common question that arises, especially when your company is new to syndicated retail sales scanner data, is “how come IRI/Nielsen sales data is different than our own shipment data?” This probably comes up most often in the context of forecasting, when you are trying to determine if you are going to “make the numbers” […]
CPG Data 911: What to Do in an Incremental Volume Emergency
If you’ve worked with CPG data for a while, you probably know that incremental volume estimates can fluctuate and look a little funky (especially in weeks with little or no trade promotion). I wrote a post about this phenomena a few weeks ago. As I stated then, usually these fluctuations are small relative to total volume […]
Fair Share Gap Analysis: How Much Is That Opportunity Worth?
In a recent post, I wrote about the importance of including competitive benchmarks in retailer category assessments. In this post, I’ll build on this concept by showing you how to construct an Opportunity Gap Analysis. This analysis examines whether the retailer is getting its fair share of category sales, compared to competitors. And, more importantly, […]
Why You Need Competitive Benchmarks in a Category Assessment
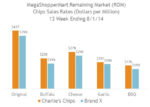
Many CPG manufacturers invest in Nielsen and IRI data to create category assessments for individual retailers. These analyses are one component of the category management process. The most compelling and accurate category assessments compare individual retailers against their competitors. And the best benchmark for this comparison is the Nielsen or IRI “remaining market.” The remaining […]
The Panel Data Chart Every CPG Analyst Should Understand
Even if you never buy Nielsen/NIQ, IRI/Circana or Numerator panel data, you should still understand this common household level analysis. Retailers who analyze their loyalty card data will often use this approach. So you’re likely to be confronted by it at some point. Here’s how it works: You break down total sales for a brand […]