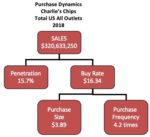
This is the first in a series of posts on how to quantify the impact of improving the various elements of purchase behavior among consumers. Some posts will focus on increasing sales for a manufacturer (probably more useful if you are in Marketing) and others will focus on increasing sales for a retailer (more useful […]
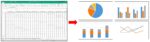
Visualization: A Picture Is Worth A Thousand Numbers
Visualization (or visualization in some places) is one of the hottest topics around lately. In fact, I just Googled both spellings and got 191 million hits for the American spelling with a “z”) and 43.4 million hits for the British spelling! Here’s what Wikipedia has to say: “Visualization (or visualisation) is any technique for creating images, diagrams, or animations to […]
Estimating Brand Distribution If You Only Have Item Level Data
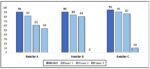
Here’s a recent question we received from a CPG Data Insights reader: “I know that ACV is not additive, but is there a way to calculate total ACV for a Brand when you have 5 UPCs with ACV measure? Can you average the ACV of the 5 UPCs for total Brand ACV?” Before I answer […]
How to Calculate A Coverage Factor
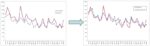
This is a follow up to this previous post that dealt with why you need to be very careful when comparing manufacturer shipments to retail sales (also called consumption or takeaway or POS data). Once you are sure that 1. periods are aligned properly, 2. geography and product definitions are as close as possible and 3. […]
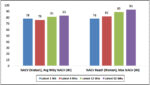
What’s With All These Similar Distribution Measures?? (Max, Reach, Average Weekly, etc.)
We’ve had several questions over the last few months regarding some facts that people are starting to notice are available in their Nielsen, IRI and/or SPINS databases. The names are very similar, but it’s not obvious how the measures are different or when you’d want to use one or the other. (With apologies to Homer […]

Volume Decomposition, Part 6 of 6: Impact of All Other Drivers (aka “Everything Else”)
This is the sixth and final post in my series on quantifying the impact of business drivers on sales volume. The first post in the series explains more about when you would want to do an analysis like this. A volume decomposition analysis allows you to explain why your volume changed by allocating the total […]