• Skip to primary navigation
  • Skip to main content
  • Skip to primary sidebar
  • Skip to footer

CPG Data Tip Sheet

Transforming your syndicated data into business insight

  • Home
  • Glossary
  • About Robin Simon
  • About Sally Martin
  • Contact
Blog » How To Communicate Insights » Page 3

How To Communicate Insights

Featured Article

Thank You, Readers on Our 10th Anniversary!...

Robin Simon

Miscellaneous

Featured Article

20 Golden Rules to Help You Shine As An Analyst

Sally Martin

How To Answer Business Questions

Featured Article

Visualization: A Picture Is Worth A Thousand Numbers...

Robin Simon

How To Communicate Insights

Featured Article

Syndicated Retail Sales Data 101...

Sally Martin

How To Get Started with Nielsen/IRI

Picture This: Stacked Bar Chart, Cousin of the Pie Chart

January 6, 2014 By Robin Simon Leave a Comment

Print Friendly, PDF & Email

As mentioned in a previous post, how you present your analysis is at least as important as the numbers themselves.  Using the right graphs is an essential element that helps you tell a story with your data, rather than just report a bunch of numbers. In this older post I talked about market share and […]

Filed Under: How To Communicate Insights Tagged With: market share, stacked bar chart, visualization

Picture This: Market Share

November 11, 2013 By Robin Simon 3 Comments

Print Friendly, PDF & Email

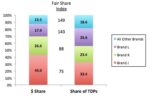
  How you present your analysis is at least as important as the numbers themselves.   One of the most basic measures to gauge how well your business is doing is share, what portion of category sales your brand accounts for.  Of course, higher is better and the sum of shares for all brands in […]

Filed Under: How To Communicate Insights Tagged With: market share, pie chart, visualization

Timing is Everything, Part II: Which Time Period(s) Should I Look At?

April 15, 2013 By Robin Simon 3 Comments

Print Friendly, PDF & Email

For a quick refresher on which time periods you can get on your database, see this previous post: Timing is Everything, Part I. Given all the possible time periods that you may have access to, it is important to first determine what business question you are trying to answer.  There are 2 ways to think […]

Filed Under: How To Communicate Insights, How To Get Started with Nielsen/IRI Tagged With: periods, time, time period

Two Excel Functions That Can Save You Hours of Formatting Time

December 17, 2012 By Sally Martin 3 Comments

Print Friendly, PDF & Email

Did you check out my post about automating reports in Excel?  I showed the right way to set up reports (so you won’t have to reformat when you get new data).   Now I want to share more about two handy Excel functions:  RIGHT and PROPER.    I used these for the retailer name, date and […]

Filed Under: How To Communicate Insights Tagged With: Excel tips

How To Automate Monthly Reports (Even If You Aren’t An Excel Wizard)

December 10, 2012 By Sally Martin 4 Comments

Print Friendly, PDF & Email

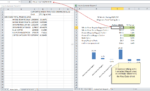
Nielsen and IRI applications make it easy to create spreadsheet based reports that can be refreshed every month.    But in their older systems like Nielsen Nitro and IRI XLerate, there is minimal formatting.   Their newer web-based systems like Nielsen Answers and IRI Liquid Data apply more formatting but that formatting doesn’t necessarily look […]

Filed Under: How To Communicate Insights Tagged With: Excel tips, Report Automation

  • « Go to Previous Page
  • Page 1
  • Page 2
  • Page 3

Primary Sidebar

Top Posts

  • The 2nd Most Important Measure: % ACV Distribution
  • Velocity: How Well Your Product REALLY Sells
  • Total Distribution Points: Master of All Distribution Measures
  • xAOC and MULO: Multi-Channel Markets in Nielsen & IRI
  • The Beginner’s Guide to Trade Merchandising Measurement

Search CPG Data Tip Sheet

Subscribe to New Posts

Get new posts delivered straight to your inbox. We won't share your email address with anyone.

Thank you for subscribing!

Subscribe

About CPG Data Tip Sheet

We (Sally Martin and Robin Simon) first met in business school and bonded over our interest in geeky marketing stuff. Eventually we both started independent consulting practices. Now we’ve reunited to share with you some of what we’ve learned in our decades of experience working with syndicated CPG data.

Categories

  • Glossary (79)
  • How To Answer Business Questions (42)
  • How To Communicate Insights (17)
  • How To Get Started with Nielsen/IRI (22)
  • How To Understand Your Database (12)
  • Know Your Measures: Distribution (24)
  • Know Your Measures: Pricing and Promotion (45)
  • Know Your Measures: Sales (21)
  • Miscellaneous (6)

Tags

ACV analysis examples analytic skills attributes average items base base weighted weeks career development category management channels characteristics coronavirus coverage factor covid-19 Database distribution due-to Excel tips Facts incremental markets Measures merchandising new items panel data periods pricing pricing strategy products promoted price quantify opportunity retailer direct data retailer markets shopper data store data Syndicated TDP the basics trade promotion trading areas velocity visualization visualizations volume bridge volume decomposition

Footer

Categories

  • Glossary (79)
  • How To Answer Business Questions (42)
  • How To Communicate Insights (17)
  • How To Get Started with Nielsen/IRI (22)
  • How To Understand Your Database (12)
  • Know Your Measures: Distribution (24)
  • Know Your Measures: Pricing and Promotion (45)
  • Know Your Measures: Sales (21)
  • Miscellaneous (6)

Search CPG Data Tip Sheet

Tags

ACV analysis examples analytic skills attributes average items base base weighted weeks career development category management channels characteristics coronavirus coverage factor covid-19 Database distribution due-to Excel tips Facts incremental markets Measures merchandising new items panel data periods pricing pricing strategy products promoted price quantify opportunity retailer direct data retailer markets shopper data store data Syndicated TDP the basics trade promotion trading areas velocity visualization visualizations volume bridge volume decomposition

Terms of Use | Copyright © 2026 CPG Data Insights · Log in