• Skip to primary navigation
  • Skip to main content
  • Skip to primary sidebar
  • Skip to footer

CPG Data Tip Sheet

Transforming your syndicated data into business insight

  • Home
  • Glossary
  • About Robin Simon
  • About Sally Martin
  • Contact
Blog » Know Your Measures: Distribution » Page 2

Know Your Measures: Distribution

Featured Article

Thank You, Readers on Our 10th Anniversary!...

Robin Simon

Miscellaneous

Featured Article

20 Golden Rules to Help You Shine As An Analyst

Sally Martin

How To Answer Business Questions

Featured Article

Visualization: A Picture Is Worth A Thousand Numbers...

Robin Simon

How To Communicate Insights

Featured Article

Syndicated Retail Sales Data 101...

Sally Martin

How To Get Started with Nielsen/IRI

Volume Decomposition, Part 2 of 6: Impact of Distribution

February 26, 2016 By Robin Simon 29 Comments

Print Friendly, PDF & Email

This is the second in a series of posts on quantifying the impact of business drivers on sales volume.  Please review these posts for more information on this very useful analytical technique that helps answer the question Why did our volume change? Part 1 – Overview of this very useful analytical technique that helps answer the […]

Filed Under: How To Answer Business Questions, Know Your Measures: Distribution Tagged With: due-to, quantify distribution volume impact, volume bridge, volume decomp

All About ACV

June 10, 2015 By Sally Martin 28 Comments

Print Friendly, PDF & Email

Earlier this year, we received a frustrated email from a reader. He wrote: “Once and for all, I would like to know exactly what ACV is. You hear several definitions depending on the site you visit. Then I would like to know how to calculate it, what it tells me, and why suppliers should care.” […]

Filed Under: Know Your Measures: Distribution, Know Your Measures: Pricing and Promotion, Know Your Measures: Sales Tagged With: ACV, distribution

Size of the Prize: How Much Is One More Point of DISTRIBUTION Worth?

May 26, 2015 By Robin Simon 20 Comments

Print Friendly, PDF & Email

In this previous post I explained how to quantify the size of the opportunity for both your brand and the category if you are getting less than your fair share of distribution. This time I will show how to quantify the impact of getting your brand into more stores, regardless of your current share of […]

Filed Under: How To Answer Business Questions, Know Your Measures: Distribution Tagged With: quantify opportunity, velocity

Are You Getting Your Fair Share of Distribution?

October 14, 2013 By Robin Simon 9 Comments

Print Friendly, PDF & Email

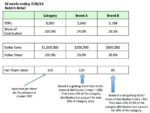
There may be an opportunity to increase sales at some retail customers by making sure that you are getting your fair share of distribution.  The basic concept is that if your brand has, say, a 25% share of category dollar sales then it should also have at least a 25% share of the category distribution. […]

Filed Under: Know Your Measures: Distribution Tagged With: distribution, fair share

Total Distribution Points: Master of All Distribution Measures

September 2, 2013 By Robin Simon 74 Comments

Print Friendly, PDF & Email

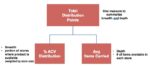
We have already discussed 2 key measures relating to distribution:  % ACV Distribution and Average Items Carried.  For product aggregations above the item level, % ACV Distribution provides a measure of distribution breadth and Average Items Carries covers depth. But what if you want to have one measure that summarizes distribution, taking into account both […]

Filed Under: Know Your Measures: Distribution Tagged With: distribution, TDP, Total Distribution Points, TPD

6 Common Questions About Average Items Carried

August 5, 2013 By Robin Simon Leave a Comment

Print Friendly, PDF & Email

Learn why Average Items Carried is important in this previous post. Even though Average Items Carried is pretty straightforward, here are some questions (and answers!) that often come up when the measure is new to an organization. Can I add together Average Items Carried across periods or geographies? NO!  It is a non-additive fact , since it is […]

Filed Under: Know Your Measures: Distribution Tagged With: AIC, AIS, average items, distribution

  • « Go to Previous Page
  • Page 1
  • Page 2
  • Page 3
  • Page 4
  • Go to Next Page »

Primary Sidebar

Top Posts

  • The 2nd Most Important Measure: % ACV Distribution
  • Velocity: How Well Your Product REALLY Sells
  • Total Distribution Points: Master of All Distribution Measures
  • xAOC and MULO: Multi-Channel Markets in Nielsen & IRI
  • The Beginner’s Guide to Trade Merchandising Measurement

Search CPG Data Tip Sheet

Subscribe to New Posts

Get new posts delivered straight to your inbox. We won't share your email address with anyone.

Thank you for subscribing!

Subscribe

About CPG Data Tip Sheet

We (Sally Martin and Robin Simon) first met in business school and bonded over our interest in geeky marketing stuff. Eventually we both started independent consulting practices. Now we’ve reunited to share with you some of what we’ve learned in our decades of experience working with syndicated CPG data.

Categories

  • Glossary (79)
  • How To Answer Business Questions (42)
  • How To Communicate Insights (17)
  • How To Get Started with Nielsen/IRI (22)
  • How To Understand Your Database (12)
  • Know Your Measures: Distribution (24)
  • Know Your Measures: Pricing and Promotion (45)
  • Know Your Measures: Sales (21)
  • Miscellaneous (6)

Tags

ACV analysis examples analytic skills attributes average items base base weighted weeks career development category management channels characteristics coronavirus coverage factor covid-19 Database distribution due-to Excel tips Facts incremental markets Measures merchandising new items panel data periods pricing pricing strategy products promoted price quantify opportunity retailer direct data retailer markets shopper data store data Syndicated TDP the basics trade promotion trading areas velocity visualization visualizations volume bridge volume decomposition

Footer

Categories

  • Glossary (79)
  • How To Answer Business Questions (42)
  • How To Communicate Insights (17)
  • How To Get Started with Nielsen/IRI (22)
  • How To Understand Your Database (12)
  • Know Your Measures: Distribution (24)
  • Know Your Measures: Pricing and Promotion (45)
  • Know Your Measures: Sales (21)
  • Miscellaneous (6)

Search CPG Data Tip Sheet

Tags

ACV analysis examples analytic skills attributes average items base base weighted weeks career development category management channels characteristics coronavirus coverage factor covid-19 Database distribution due-to Excel tips Facts incremental markets Measures merchandising new items panel data periods pricing pricing strategy products promoted price quantify opportunity retailer direct data retailer markets shopper data store data Syndicated TDP the basics trade promotion trading areas velocity visualization visualizations volume bridge volume decomposition

Terms of Use | Copyright © 2025 CPG Data Insights · Log in