• Skip to primary navigation
  • Skip to main content
  • Skip to primary sidebar
  • Skip to footer

CPG Data Tip Sheet

Transforming your syndicated data into business insight

  • Home
  • Glossary
  • About Robin Simon
  • About Sally Martin
  • Contact
Blog » How To Answer Business Questions » Page 2

How To Answer Business Questions

Featured Article

Thank You, Readers on Our 10th Anniversary!...

Robin Simon

Miscellaneous

Featured Article

20 Golden Rules to Help You Shine As An Analyst

Sally Martin

How To Answer Business Questions

Featured Article

Visualization: A Picture Is Worth A Thousand Numbers...

Robin Simon

How To Communicate Insights

Featured Article

Syndicated Retail Sales Data 101...

Sally Martin

How To Get Started with Nielsen/IRI

More On Panel Data + Shopping Behavior During the COVID-19 Pandemic

June 16, 2020 By Sally Martin Leave a Comment

Print Friendly, PDF & Email

Recently, I wrote about a Nielsen chart illustrating consumer behavior in the U.S. during the COVID-19 pandemic. In this post, I’ll show these same metrics from another panel provider: Numerator.  Numerator (formerly known as InfoScout) gathers their panel data by having panelists take photos of physical receipts and provide access to their e-receipts. That’s a […]

Filed Under: How To Answer Business Questions, How To Communicate Insights Tagged With: coronavirus, covid-19, panel data, visualizations

A Panel Data Case Study: Shopper Behavior During COVID-19

May 26, 2020 By Sally Martin 2 Comments

Print Friendly, PDF & Email

As I shared recently, there is a wealth of free, public information coming out from data providers on consumer behavior during these crazy times. In this post, I’ll highlight, explain, and critique a chart published by Nielsen. Next week, I’ll share a similar chart from Numerator.  Taking it back a step, what is panel data? […]

Filed Under: How To Answer Business Questions, How To Communicate Insights Tagged With: coronavirus, covid-19, panel data, visualizations

covid-19 blue

Analysis Tips During Very Uncertain Times

April 16, 2020 By Robin Simon 1 Comment

Print Friendly, PDF & Email

In these uncertain times, you’re probably asking (or being asked) questions like: What will the business look like for the rest of the year?  Will it get back to normal and, if so, when?  Will there be a “new normal” and what will that look like?  Of course, there is no one right answer to […]

Filed Under: How To Answer Business Questions Tagged With: analytic skills, coronavirus, covid-19, uncertain times

20 Golden Rules to Help You Shine As An Analyst

February 27, 2020 By Sally Martin 6 Comments

Print Friendly, PDF & Email

I was recently purging some old files. I found a long-buried gem, from my IRI days, that I want to share with you. These words of wisdom came from my all-star manager, Linda Abraham. Linda went on to co-found Comscore and is now an investor and advisor to tech companies. Note: when Linda crafted her […]

Filed Under: How To Answer Business Questions, How To Communicate Insights Tagged With: analytic skills, career development

understanding your shopper demographics

Who Is Your Shopper? Decoding the Panel Data “Demographic” Report.

October 16, 2019 By Sally Martin Leave a Comment

Print Friendly, PDF & Email

Marketers need to paint a picture of their buyers, humanizing them and understanding their preferences. This is not only important for general messaging but also necessary for target marketing. Syndicated household and shopper panel data is an excellent tool for helping to understand consumer characteristics. Not familiar with this panel data? You may want to […]

Filed Under: How To Answer Business Questions Tagged With: panel data, shopper data, shopper marketing

Who’s NOT Selling My Products? or How to Identify Distribution Voids

August 27, 2019 By Robin Simon 3 Comments

Print Friendly, PDF & Email

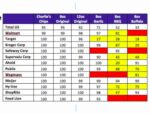
Let’s start with stating the obvious:  Shoppers cannot buy your products if they are not available where they shop.  Even though your brand may have 12 different items in its product line, not every retailer carries every item.  You can identify which retailers sell which items using a relatively straightforward data pull from IRI or […]

Filed Under: How To Answer Business Questions, Know Your Measures: Distribution Tagged With: distribution, distribution opportunity, distribution void, void

  • « Go to Previous Page
  • Page 1
  • Page 2
  • Page 3
  • Page 4
  • Interim pages omitted …
  • Page 7
  • Go to Next Page »

Primary Sidebar

Top Posts

  • The 2nd Most Important Measure: % ACV Distribution
  • Velocity: How Well Your Product REALLY Sells
  • Total Distribution Points: Master of All Distribution Measures
  • xAOC and MULO: Multi-Channel Markets in Nielsen & IRI
  • The Beginner’s Guide to Trade Merchandising Measurement

Search CPG Data Tip Sheet

Subscribe to New Posts

Get new posts delivered straight to your inbox. We won't share your email address with anyone.

Thank you for subscribing!

Subscribe

About CPG Data Tip Sheet

We (Sally Martin and Robin Simon) first met in business school and bonded over our interest in geeky marketing stuff. Eventually we both started independent consulting practices. Now we’ve reunited to share with you some of what we’ve learned in our decades of experience working with syndicated CPG data.

Categories

  • Glossary (79)
  • How To Answer Business Questions (42)
  • How To Communicate Insights (17)
  • How To Get Started with Nielsen/IRI (22)
  • How To Understand Your Database (12)
  • Know Your Measures: Distribution (24)
  • Know Your Measures: Pricing and Promotion (45)
  • Know Your Measures: Sales (21)
  • Miscellaneous (6)

Tags

ACV analysis examples analytic skills attributes average items base base weighted weeks career development category management channels characteristics coronavirus coverage factor covid-19 Database distribution due-to Excel tips Facts incremental markets Measures merchandising new items panel data periods pricing pricing strategy products promoted price quantify opportunity retailer direct data retailer markets shopper data store data Syndicated TDP the basics trade promotion trading areas velocity visualization visualizations volume bridge volume decomposition

Footer

Categories

  • Glossary (79)
  • How To Answer Business Questions (42)
  • How To Communicate Insights (17)
  • How To Get Started with Nielsen/IRI (22)
  • How To Understand Your Database (12)
  • Know Your Measures: Distribution (24)
  • Know Your Measures: Pricing and Promotion (45)
  • Know Your Measures: Sales (21)
  • Miscellaneous (6)

Search CPG Data Tip Sheet

Tags

ACV analysis examples analytic skills attributes average items base base weighted weeks career development category management channels characteristics coronavirus coverage factor covid-19 Database distribution due-to Excel tips Facts incremental markets Measures merchandising new items panel data periods pricing pricing strategy products promoted price quantify opportunity retailer direct data retailer markets shopper data store data Syndicated TDP the basics trade promotion trading areas velocity visualization visualizations volume bridge volume decomposition

Terms of Use | Copyright © 2025 CPG Data Insights · Log in