• Skip to primary navigation
  • Skip to main content
  • Skip to primary sidebar
  • Skip to footer

CPG Data Tip Sheet

Transforming your syndicated data into business insight

  • Home
  • Glossary
  • About Robin Simon
  • About Sally Martin
  • Contact
Blog » Know Your Measures: Distribution

Know Your Measures: Distribution

Featured Article

Thank You, Readers on Our 10th Anniversary!...

Robin Simon

Miscellaneous

Featured Article

20 Golden Rules to Help You Shine As An Analyst

Sally Martin

How To Answer Business Questions

Featured Article

Visualization: A Picture Is Worth A Thousand Numbers...

Robin Simon

How To Communicate Insights

Featured Article

Syndicated Retail Sales Data 101...

Sally Martin

How To Get Started with Nielsen/IRI

Velocity Q&A

Tip Sheet Mailbag: Velocity Q&A – The Sequel

November 29, 2023 By Sally Martin 2 Comments

Print Friendly, PDF & Email

We hope you aren’t tired of reading about velocity! Velocity and distribution (which go hand in hand, as you’ll see below) are the topics we are asked about most often. We’ve reviewed our reader correspondence and pulled out a few more key points we wanted to share: Question 1: Is Velocity Independent of Distribution? Q. […]

Filed Under: Know Your Measures: Distribution, Know Your Measures: Sales

Who’s NOT Selling My Products? or How to Identify Distribution Voids

August 27, 2019 By Robin Simon 3 Comments

Print Friendly, PDF & Email

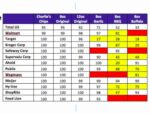
Let’s start with stating the obvious:  Shoppers cannot buy your products if they are not available where they shop.  Even though your brand may have 12 different items in its product line, not every retailer carries every item.  You can identify which retailers sell which items using a relatively straightforward data pull from IRI or […]

Filed Under: How To Answer Business Questions, Know Your Measures: Distribution Tagged With: distribution, distribution opportunity, distribution void, void

Estimating Brand Distribution If You Only Have Item Level Data

July 1, 2018 By Robin Simon 4 Comments

Print Friendly, PDF & Email

Here’s a recent question we received from a CPG Data Insights reader: “I know that ACV is not additive, but is there a way to calculate total ACV for a Brand when you have 5 UPCs with ACV measure? Can you average the ACV of the 5 UPCs for total Brand ACV?” Before I answer […]

Filed Under: Know Your Measures: Distribution Tagged With: Brand % ACV, Item level data

What’s With All These Similar Distribution Measures?? (Max, Reach, Average Weekly, etc.)

November 13, 2017 By Robin Simon 5 Comments

Print Friendly, PDF & Email

We’ve had several questions over the last few months regarding some facts that people are starting to notice are available in their Nielsen, IRI and/or SPINS databases.   The names are very similar, but it’s not obvious how the measures are different or when you’d want to use one or the other.  (With apologies to Homer […]

Filed Under: Know Your Measures: Distribution Tagged With: avg weekly, distribution, max, reach

Enhancing Your Analysis with TDP, Part 2: Explaining Sales Trends

May 30, 2017 By Sally Martin 2 Comments

Print Friendly, PDF & Email

In a recent post, I illustrated the most common usage of Total Points of Distribution (TDP) – as a substitute for % ACV in velocity calculations. In this post, I’ll share another one of my favorite ways to leverage the TDP data metric, which is explaining sales trends. If you aren’t familiar with TDP, read […]

Filed Under: How To Answer Business Questions, Know Your Measures: Distribution Tagged With: analysis examples, distribution, TDP

Using TDP to Enhance Your Analysis, Part 1: Velocity

April 27, 2017 By Sally Martin 6 Comments

Print Friendly, PDF & Email

TDP (a.k.a. Total Distribution Points) is my favorite syndicated data measure. Why? Because distribution is fundamental to any business question. Therefore, it’s a great place to start when looking for answers. And TDP is the broadest, most flexible way to examine this crucial dimension. If you are looking at individual UPCs, you don’t need TDP – […]

Filed Under: How To Answer Business Questions, Know Your Measures: Distribution Tagged With: analysis examples, distribution, TDP, velocity

  • Page 1
  • Page 2
  • Page 3
  • Page 4
  • Go to Next Page »

Primary Sidebar

Top Posts

  • The 2nd Most Important Measure: % ACV Distribution
  • Velocity: How Well Your Product REALLY Sells
  • Total Distribution Points: Master of All Distribution Measures
  • xAOC and MULO: Multi-Channel Markets in Nielsen & IRI
  • The Beginner’s Guide to Trade Merchandising Measurement

Search CPG Data Tip Sheet

Subscribe to New Posts

Get new posts delivered straight to your inbox. We won't share your email address with anyone.

Thank you for subscribing!

Subscribe

About CPG Data Tip Sheet

We (Sally Martin and Robin Simon) first met in business school and bonded over our interest in geeky marketing stuff. Eventually we both started independent consulting practices. Now we’ve reunited to share with you some of what we’ve learned in our decades of experience working with syndicated CPG data.

Categories

  • Glossary (79)
  • How To Answer Business Questions (42)
  • How To Communicate Insights (17)
  • How To Get Started with Nielsen/IRI (22)
  • How To Understand Your Database (12)
  • Know Your Measures: Distribution (24)
  • Know Your Measures: Pricing and Promotion (45)
  • Know Your Measures: Sales (21)
  • Miscellaneous (6)

Tags

ACV analysis examples analytic skills attributes average items base base weighted weeks career development category management channels characteristics coronavirus coverage factor covid-19 Database distribution due-to Excel tips Facts incremental markets Measures merchandising new items panel data periods pricing pricing strategy products promoted price quantify opportunity retailer direct data retailer markets shopper data store data Syndicated TDP the basics trade promotion trading areas velocity visualization visualizations volume bridge volume decomposition

Footer

Categories

  • Glossary (79)
  • How To Answer Business Questions (42)
  • How To Communicate Insights (17)
  • How To Get Started with Nielsen/IRI (22)
  • How To Understand Your Database (12)
  • Know Your Measures: Distribution (24)
  • Know Your Measures: Pricing and Promotion (45)
  • Know Your Measures: Sales (21)
  • Miscellaneous (6)

Search CPG Data Tip Sheet

Tags

ACV analysis examples analytic skills attributes average items base base weighted weeks career development category management channels characteristics coronavirus coverage factor covid-19 Database distribution due-to Excel tips Facts incremental markets Measures merchandising new items panel data periods pricing pricing strategy products promoted price quantify opportunity retailer direct data retailer markets shopper data store data Syndicated TDP the basics trade promotion trading areas velocity visualization visualizations volume bridge volume decomposition

Terms of Use | Copyright © 2025 CPG Data Insights · Log in