• Skip to primary navigation
  • Skip to main content
  • Skip to primary sidebar
  • Skip to footer

CPG Data Tip Sheet

Transforming your syndicated data into business insight

  • Home
  • Glossary
  • About
  • Subscribe or Contact
Featured Article

Thank You, Readers on Our 10th Anniversary!...

Robin Simon

Miscellaneous

Featured Article

20 Golden Rules to Help You Shine As An Analyst

Sally Martin

How To Answer Business Questions

Featured Article

Visualization: A Picture Is Worth A Thousand Numbers...

Robin Simon

How To Communicate Insights

Featured Article

Syndicated Retail Sales Data 101...

Sally Martin

How To Get Started with Nielsen/IRI

Why You Need Competitive Benchmarks in a Category Assessment

May 13, 2013 By Sally Martin 8 Comments

Print Friendly, PDF & Email

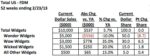
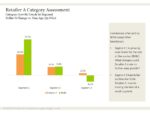
Many CPG manufacturers invest in Nielsen and IRI data to create category assessments for individual retailers. These analyses are one component of the category management process. The most compelling and accurate category assessments compare individual retailers against their competitors. And the best benchmark for this comparison is the Nielsen or IRI “remaining market.” The remaining […]

Filed Under: How To Answer Business Questions Tagged With: category management, retailer markets, trading areas

xAOC and MULO: Multi-Channel Markets in Nielsen & IRI

April 29, 2013 By Robin Simon 40 Comments

Print Friendly, PDF & Email

Are you confused by the terms “xAOC” or “MULO?”  Do you wonder what happened to FDMx?  (Do you even know what FDMx is?)  This post will clear things up for you!   These are the terms that IRI and Nielsen use for  their multi-channel markets.  These markets are designed to provide an estimate of sales across […]

Filed Under: How To Get Started with Nielsen/IRI, How To Understand Your Database Tagged With: FDM, FDMx, markets, markets available, MULO, xAOC

Timing is Everything, Part II: Which Time Period(s) Should I Look At?

April 15, 2013 By Robin Simon 3 Comments

Print Friendly, PDF & Email

For a quick refresher on which time periods you can get on your database, see this previous post: Timing is Everything, Part I. Given all the possible time periods that you may have access to, it is important to first determine what business question you are trying to answer.  There are 2 ways to think […]

Filed Under: How To Communicate Insights, How To Get Started with Nielsen/IRI Tagged With: periods, time, time period

The Panel Data Chart Every CPG Analyst Should Understand

April 8, 2013 By Sally Martin 12 Comments

Print Friendly, PDF & Email

Even if you never buy Nielsen/NIQ, IRI/Circana or Numerator panel data, you should still understand this common household level analysis.  Retailers who analyze their loyalty card data will often use this approach.  So you’re likely to be confronted by it at some point. Here’s how it works: You break down total sales for a brand […]

Filed Under: How To Answer Business Questions Tagged With: panel data

Data Dictionary: 4 Key Household Panel Measures

April 8, 2013 By Sally Martin 6 Comments

Print Friendly, PDF & Email

Need to get up to speed on household panel data? Wondering where to start?  If you’re not sure where Nielsen and IRI panel data comes from, start with our panel overview post.   If you’re ready to dig into the data, read on.   Here’s what you’ll learn in this post: Definitions for four key […]

Filed Under: How To Get Started with Nielsen/IRI, Know Your Measures: Sales Tagged With: panel data

Household Panel: The Other Data

March 18, 2013 By Sally Martin 18 Comments

Print Friendly, PDF & Email

Coke and Sprite, Batman and Catwoman, Abercrombie and Hollister.   Two similar ways of addressing a need, each with its own twist.    In the Nielsen/IRI world, that duo is Store Data and Panel Data. Store data is your basic, bread and butter sales tracking tool.  It is gathered from retailers through their scanner/POS systems.   It’s the […]

Filed Under: How To Get Started with Nielsen/IRI Tagged With: household data, panel data

  • « Go to Previous Page
  • Page 1
  • Interim pages omitted …
  • Page 15
  • Page 16
  • Page 17
  • Page 18
  • Page 19
  • Interim pages omitted …
  • Page 32
  • Go to Next Page »

Primary Sidebar

Top Posts

  • The 2nd Most Important Measure: % ACV Distribution
  • Velocity: How Well Your Product REALLY Sells
  • Total Distribution Points: Master of All Distribution Measures
  • xAOC and MULO: Multi-Channel Markets in Nielsen & IRI
  • The Beginner’s Guide to Trade Merchandising Measurement

Search CPG Data Tip Sheet

About CPG Data Tip Sheet

We (Sally Martin and Robin Simon) first met in business school and bonded over our interest in geeky marketing stuff. Eventually we both started independent consulting practices. Now we’ve reunited to share with you some of what we’ve learned in our decades of experience working with syndicated CPG data.

Categories

  • Glossary (79)
  • How To Answer Business Questions (42)
  • How To Communicate Insights (18)
  • How To Get Started with Nielsen/IRI (22)
  • How To Understand Your Database (13)
  • Know Your Measures: Distribution (24)
  • Know Your Measures: Pricing and Promotion (45)
  • Know Your Measures: Sales (21)
  • Miscellaneous (6)
  • Uncategorized (1)

Tags

ACV analysis examples analytic skills attributes average items base base weighted weeks career development category management channels characteristics coronavirus coverage factor covid-19 Database distribution due-to Excel tips Facts incremental markets Measures merchandising new items panel data periods pricing pricing strategy products promoted price quantify opportunity retailer direct data retailer markets shopper data store data Syndicated TDP the basics trade promotion trading areas velocity visualization visualizations volume bridge volume decomposition

Footer

Categories

  • Glossary (79)
  • How To Answer Business Questions (42)
  • How To Communicate Insights (18)
  • How To Get Started with Nielsen/IRI (22)
  • How To Understand Your Database (13)
  • Know Your Measures: Distribution (24)
  • Know Your Measures: Pricing and Promotion (45)
  • Know Your Measures: Sales (21)
  • Miscellaneous (6)
  • Uncategorized (1)

Search CPG Data Tip Sheet

Tags

ACV analysis examples analytic skills attributes average items base base weighted weeks career development category management channels characteristics coronavirus coverage factor covid-19 Database distribution due-to Excel tips Facts incremental markets Measures merchandising new items panel data periods pricing pricing strategy products promoted price quantify opportunity retailer direct data retailer markets shopper data store data Syndicated TDP the basics trade promotion trading areas velocity visualization visualizations volume bridge volume decomposition

Terms of Use | Copyright © 2026 CPG Data Insights · Log in