• Skip to primary navigation
  • Skip to main content
  • Skip to primary sidebar
  • Skip to footer

CPG Data Tip Sheet

Transforming your syndicated data into business insight

  • Home
  • Glossary
  • About
  • Contact Us
  • Subscribe
Blog » distribution » Page 2

distribution

How to Build an Argument for Increased Retail Distribution

August 4, 2014 By Sally Martin 6 Comments

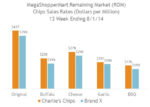
  Over the last year, we’ve written lots of articles showing you how to use key IRI/Nielsen measures. In this post, I’ll pull together several of those lessons in a step-by-step mini case study. The goal of this analysis is a common one: convince a retailer to increase the number of varieties for our target […]

Filed Under: How To Answer Business Questions Tagged With: analysis examples, distribution

Are You Getting Your Fair Share of Distribution?

October 14, 2013 By Robin Simon 9 Comments

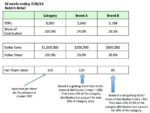
There may be an opportunity to increase sales at some retail customers by making sure that you are getting your fair share of distribution.  The basic concept is that if your brand has, say, a 25% share of category dollar sales then it should also have at least a 25% share of the category distribution. […]
Filed Under: Know Your Measures: Distribution Tagged With: distribution, fair share

Total Distribution Points: Master of All Distribution Measures

September 2, 2013 By Robin Simon 74 Comments

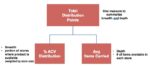
We have already discussed 2 key measures relating to distribution:  % ACV Distribution and Average Items Carried.  For product aggregations above the item level, % ACV Distribution provides a measure of distribution breadth and Average Items Carries covers depth. But what if you want to have one measure that summarizes distribution, taking into account both […]

Filed Under: Know Your Measures: Distribution Tagged With: distribution, TDP, Total Distribution Points, TPD

6 Common Questions About Average Items Carried

August 5, 2013 By Robin Simon Leave a Comment

Learn why Average Items Carried is important in this previous post. Even though Average Items Carried is pretty straightforward, here are some questions (and answers!) that often come up when the measure is new to an organization. Can I add together Average Items Carried across periods or geographies? NO!  It is a non-additive fact , since it is […]
Filed Under: Know Your Measures: Distribution Tagged With: AIC, AIS, average items, distribution

How To Identify Distribution Opportunities When Your Brand Is Already “Everywhere”

July 22, 2013 By Robin Simon 8 Comments

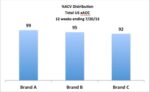
As mentioned in a previous post, shoppers cannot buy something if it’s not in the store!  That’s why having good distribution is so important to your business.  What can you do to increase distribution when your brand is already in at least 90% ACV distribution? Let’s look at an example.  Say there are 3 brands […]
Filed Under: Know Your Measures: Distribution Tagged With: average items, distribution

How to Calculate Average Items Carried

July 22, 2013 By Robin Simon 28 Comments

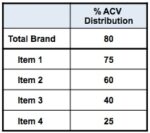
If Average Items Carried (or Average Items Selling) is not available on your database, it is easy to calculate in Excel.  It is just the sum of % ACV Distribution of all the items divided by the % ACV Distribution of the brand. Here is an example: Say a brand is made up of 4 […]

Filed Under: Know Your Measures: Distribution Tagged With: AIC, AIS, average items, distribution

  • « Go to Previous Page
  • Page 1
  • Page 2
  • Page 3
  • Go to Next Page »

Primary Sidebar

Top Posts

  • The 2nd Most Important Measure: % ACV Distribution
  • Velocity: How Well Your Product REALLY Sells
  • Total Distribution Points: Master of All Distribution Measures
  • xAOC and MULO: Multi-Channel Markets in Nielsen & IRI
  • The Beginner’s Guide to Trade Merchandising Measurement

Search CPG Data Tip Sheet

About CPG Data Tip Sheet

The CPG Data Tip Sheet is published by Kevin Lehmann and Goods Group. It was founded in 2012 by Sally Martin and Robin Simon, two consultants who met in business school over a shared interest in the geeky side of marketing and went on to build independent practices of their own. Over more than a decade they turned hard-won experience into plain-English explanations of how CPG data actually works and how to analyze it.

Robin and Sally built this into something the CPG and consumer industry trusts. It continues in that spirit.

Categories

  • Glossary (80)
  • How To Answer Business Questions (43)
  • How To Communicate Insights (19)
  • How To Get Started with Nielsen/IRI (22)
  • How To Understand Your Database (13)
  • Know Your Measures: Distribution (25)
  • Know Your Measures: Pricing and Promotion (45)
  • Know Your Measures: Sales (21)
  • Miscellaneous (6)
  • Uncategorized (1)

Tags

ACV analysis examples analytic skills attributes average items base base weighted weeks career development category management channels characteristics coronavirus coverage factor covid-19 Database distribution due-to Excel tips Facts incremental markets Measures merchandising new items panel data periods pricing pricing strategy products promoted price quantify opportunity retailer direct data retailer markets shopper data store data Syndicated TDP the basics trade promotion trading areas velocity visualization visualizations volume bridge volume decomposition

Footer

Categories

  • Glossary (80)
  • How To Answer Business Questions (43)
  • How To Communicate Insights (19)
  • How To Get Started with Nielsen/IRI (22)
  • How To Understand Your Database (13)
  • Know Your Measures: Distribution (25)
  • Know Your Measures: Pricing and Promotion (45)
  • Know Your Measures: Sales (21)
  • Miscellaneous (6)
  • Uncategorized (1)

Search CPG Data Tip Sheet

Tags

ACV analysis examples analytic skills attributes average items base base weighted weeks career development category management channels characteristics coronavirus coverage factor covid-19 Database distribution due-to Excel tips Facts incremental markets Measures merchandising new items panel data periods pricing pricing strategy products promoted price quantify opportunity retailer direct data retailer markets shopper data store data Syndicated TDP the basics trade promotion trading areas velocity visualization visualizations volume bridge volume decomposition

Terms of Use | Copyright © 2026 CPG Data Insights · Log in