• Skip to primary navigation
  • Skip to main content
  • Skip to primary sidebar
  • Skip to footer

CPG Data Tip Sheet

Transforming your syndicated data into business insight

  • Home
  • Glossary
  • About Robin Simon
  • About Sally Martin
  • Contact
Blog » panel data

panel data

Featured Article

Thank You, Readers on Our 10th Anniversary!...

Robin Simon

Miscellaneous

Featured Article

20 Golden Rules to Help You Shine As An Analyst

Sally Martin

How To Answer Business Questions

Featured Article

Visualization: A Picture Is Worth A Thousand Numbers...

Robin Simon

How To Communicate Insights

Featured Article

Syndicated Retail Sales Data 101...

Sally Martin

How To Get Started with Nielsen/IRI

Volume Decomposition Using Panel Data: Why Are Sales Up or Down?

April 30, 2025 By Robin Simon Leave a Comment

Many people are familiar with the analysis known as a volume decomposition (or due-to) that uses POS data.  This allows you to explain a change in sales and attribute gains and losses to specific business drivers like distribution, pricing, trade promotion and some other things.  We have a series of posts on this, starting with […]

Filed Under: How To Answer Business Questions Tagged With: due-to, panel data, volume decomposition

More On Panel Data + Shopping Behavior During the COVID-19 Pandemic

June 16, 2020 By Sally Martin Leave a Comment

Recently, I wrote about a Nielsen chart illustrating consumer behavior in the U.S. during the COVID-19 pandemic. In this post, I’ll show these same metrics from another panel provider: Numerator.  Numerator (formerly known as InfoScout) gathers their panel data by having panelists take photos of physical receipts and provide access to their e-receipts. That’s a […]

Filed Under: How To Answer Business Questions, How To Communicate Insights Tagged With: coronavirus, covid-19, panel data, visualizations

A Panel Data Case Study: Shopper Behavior During COVID-19

May 26, 2020 By Sally Martin 2 Comments

As I shared recently, there is a wealth of free, public information coming out from data providers on consumer behavior during these crazy times. In this post, I’ll highlight, explain, and critique a chart published by Nielsen. Next week, I’ll share a similar chart from Numerator.  Taking it back a step, what is panel data? […]

Filed Under: How To Answer Business Questions, How To Communicate Insights Tagged With: coronavirus, covid-19, panel data, visualizations

understanding your shopper demographics

Who Is Your Shopper? Decoding the Panel Data “Demographic” Report.

October 16, 2019 By Sally Martin Leave a Comment

Marketers need to paint a picture of their buyers, humanizing them and understanding their preferences. This is not only important for general messaging but also necessary for target marketing. Syndicated household and shopper panel data is an excellent tool for helping to understand consumer characteristics. Not familiar with this panel data? You may want to […]

Filed Under: How To Answer Business Questions Tagged With: panel data, shopper data, shopper marketing

Shopper Segmentation

Segmenting Shoppers: Not All Shoppers Are Contributing the Same to Your Category Performance

June 19, 2019 By Guest 4 Comments

It’s a pleasure to feature this guest post from our colleague and fellow consultant Dan Wasser. Dan’s data expertise and savvy insights derive from long experience with syndicated data and category management in a variety of roles. You can learn more about Dan (and how to contact him) at the end of this article.  Robin […]

Filed Under: How To Answer Business Questions Tagged With: panel data, segmentation, shopper data, shopper marketing

Size of The Prize: How Much Is It Worth If Shoppers Buy ONE MORE TIME?

May 14, 2019 By Robin Simon 6 Comments

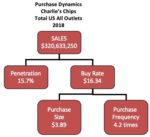
This is the second in a series of posts on how to quantify the impact of improving the various elements of consumers’ purchase behavior. These purchase behavior analyses are based on household panel/shopper data (not POS/store data).  Take a look at these posts if you need a refresher on this type of data: Overview of […]

Filed Under: How To Answer Business Questions Tagged With: panel data, purchase frequency, shopper data

  • Page 1
  • Page 2
  • Page 3
  • Go to Next Page »

Primary Sidebar

Top Posts

  • The 2nd Most Important Measure: % ACV Distribution
  • Velocity: How Well Your Product REALLY Sells
  • Total Distribution Points: Master of All Distribution Measures
  • xAOC and MULO: Multi-Channel Markets in Nielsen & IRI
  • The Beginner’s Guide to Trade Merchandising Measurement

Search CPG Data Tip Sheet

Subscribe to New Posts

Get new posts delivered straight to your inbox. We won't share your email address with anyone.

Thank you for subscribing!

Subscribe

About CPG Data Tip Sheet

We (Sally Martin and Robin Simon) first met in business school and bonded over our interest in geeky marketing stuff. Eventually we both started independent consulting practices. Now we’ve reunited to share with you some of what we’ve learned in our decades of experience working with syndicated CPG data.

Categories

  • Glossary (79)
  • How To Answer Business Questions (42)
  • How To Communicate Insights (17)
  • How To Get Started with Nielsen/IRI (22)
  • How To Understand Your Database (12)
  • Know Your Measures: Distribution (24)
  • Know Your Measures: Pricing and Promotion (45)
  • Know Your Measures: Sales (21)
  • Miscellaneous (6)

Tags

ACV analysis examples analytic skills attributes average items base base weighted weeks career development category management channels characteristics coronavirus coverage factor covid-19 Database distribution due-to Excel tips Facts incremental markets Measures merchandising new items panel data periods pricing pricing strategy products promoted price quantify opportunity retailer direct data retailer markets shopper data store data Syndicated TDP the basics trade promotion trading areas velocity visualization visualizations volume bridge volume decomposition

Footer

Categories

  • Glossary (79)
  • How To Answer Business Questions (42)
  • How To Communicate Insights (17)
  • How To Get Started with Nielsen/IRI (22)
  • How To Understand Your Database (12)
  • Know Your Measures: Distribution (24)
  • Know Your Measures: Pricing and Promotion (45)
  • Know Your Measures: Sales (21)
  • Miscellaneous (6)

Search CPG Data Tip Sheet

Tags

ACV analysis examples analytic skills attributes average items base base weighted weeks career development category management channels characteristics coronavirus coverage factor covid-19 Database distribution due-to Excel tips Facts incremental markets Measures merchandising new items panel data periods pricing pricing strategy products promoted price quantify opportunity retailer direct data retailer markets shopper data store data Syndicated TDP the basics trade promotion trading areas velocity visualization visualizations volume bridge volume decomposition

Terms of Use | Copyright © 2025 CPG Data Insights · Log in