• Skip to primary navigation
  • Skip to main content
  • Skip to primary sidebar
  • Skip to footer

CPG Data Tip Sheet

Transforming your syndicated data into business insight

  • Home
  • Glossary
  • About Robin Simon
  • About Sally Martin
  • Contact
Blog » Robin Simon » Page 6

Robin Simon

Featured Article

Thank You, Readers on Our 10th Anniversary!...

Robin Simon

Miscellaneous

Featured Article

20 Golden Rules to Help You Shine As An Analyst

Sally Martin

How To Answer Business Questions

Featured Article

Visualization: A Picture Is Worth A Thousand Numbers...

Robin Simon

How To Communicate Insights

Featured Article

Syndicated Retail Sales Data 101...

Sally Martin

How To Get Started with Nielsen/IRI

Price per What: Avoid Comparing Apples and Oranges

June 11, 2014 By Robin Simon 2 Comments

As mentioned in this earlier post, you may be able to choose from over 200 different pricing facts on your database! One of the reasons there are so many price measures is because all of them are available for price per unit AND price per volume. Price per unit is the retail price paid per […]

Filed Under: Know Your Measures: Pricing and Promotion Tagged With: PPG, price per EQ, price per volume, priceper unit, promoted product group

Q. What’s your retail price? A. It depends!

May 13, 2014 By Robin Simon 6 Comments

According to the dictionary, the price of something is “the sum or amount of money or its equivalent for which anything is bought, sold, or offered for sale.” Pricing is one of the “4 Ps” of marketing that we learned about in school (along with Product, Placement/Distribution and Promotion) and is often a key driver […]

Filed Under: Know Your Measures: Pricing and Promotion Tagged With: average price, base price, everyday price, promoted price, retail price, sale price

The Case of the Mismatched Volume: Comparing Shipments and Retail Sales

April 16, 2014 By Robin Simon 11 Comments

A common question that arises, especially when your company is new to syndicated retail sales scanner data, is “how come IRI/Nielsen sales data is different than our own shipment data?”  This probably comes up most often in the context of forecasting, when you are trying to determine if you are going to “make the numbers” […]

Filed Under: How To Answer Business Questions, Know Your Measures: Sales Tagged With: coverage factor, matching up sales, shipments vs. consumption

Product Attributes: The Key to Meaningful Analysis

March 17, 2014 By Robin Simon 6 Comments

A product’s attributes are what makes it distinct from other products.  Attributes include things like size, color, flavor, package type and other features that are relevant to the category.   From a consumer perspective, these attributes are what determine the consideration set and influence the ultimate purchase decision.   From a retail perspective, product attributes help define […]

Filed Under: How To Understand Your Database Tagged With: attributes, characteristics, products

Picture This: Time After Time, The Line Chart

February 16, 2014 By Robin Simon

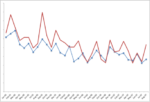
One of the most powerful graphs is the line chart.  Line charts allow you to: Decode underlying trends over time Compare trends for different products or markets Explore relationships  between different measures In addition to making it easier to see trends, you will typically use a line graph because there’s just too much data to […]

Filed Under: How To Communicate Insights Tagged With: line chart, trend chart, visualization

Picture This: Bar Chart, The Go-To Graph

January 19, 2014 By Robin Simon Leave a Comment

The bar chart is probably the most commonly used type of graph and this post talks about what kind of data this works well for.  In this post I’ll  talk about using bar charts to compare various products and geographies but for one fact and one time period.  This is part of a series of […]

Filed Under: How To Communicate Insights Tagged With: bar chart, visualization

  • « Go to Previous Page
  • Page 1
  • Interim pages omitted …
  • Page 4
  • Page 5
  • Page 6
  • Page 7
  • Page 8
  • Interim pages omitted …
  • Page 19
  • Go to Next Page »

Primary Sidebar

Top Posts

  • The 2nd Most Important Measure: % ACV Distribution
  • Velocity: How Well Your Product REALLY Sells
  • Total Distribution Points: Master of All Distribution Measures
  • xAOC and MULO: Multi-Channel Markets in Nielsen & IRI
  • The Beginner’s Guide to Trade Merchandising Measurement

Search CPG Data Tip Sheet

Subscribe to New Posts

Get new posts delivered straight to your inbox. We won't share your email address with anyone.

Thank you for subscribing!

Subscribe

About CPG Data Tip Sheet

We (Sally Martin and Robin Simon) first met in business school and bonded over our interest in geeky marketing stuff. Eventually we both started independent consulting practices. Now we’ve reunited to share with you some of what we’ve learned in our decades of experience working with syndicated CPG data.

Categories

  • Glossary (79)
  • How To Answer Business Questions (42)
  • How To Communicate Insights (17)
  • How To Get Started with Nielsen/IRI (22)
  • How To Understand Your Database (12)
  • Know Your Measures: Distribution (24)
  • Know Your Measures: Pricing and Promotion (45)
  • Know Your Measures: Sales (21)
  • Miscellaneous (6)

Tags

ACV analysis examples analytic skills attributes average items base base weighted weeks career development category management channels characteristics coronavirus coverage factor covid-19 Database distribution due-to Excel tips Facts incremental markets Measures merchandising new items panel data periods pricing pricing strategy products promoted price quantify opportunity retailer direct data retailer markets shopper data store data Syndicated TDP the basics trade promotion trading areas velocity visualization visualizations volume bridge volume decomposition

Footer

Categories

  • Glossary (79)
  • How To Answer Business Questions (42)
  • How To Communicate Insights (17)
  • How To Get Started with Nielsen/IRI (22)
  • How To Understand Your Database (12)
  • Know Your Measures: Distribution (24)
  • Know Your Measures: Pricing and Promotion (45)
  • Know Your Measures: Sales (21)
  • Miscellaneous (6)

Search CPG Data Tip Sheet

Tags

ACV analysis examples analytic skills attributes average items base base weighted weeks career development category management channels characteristics coronavirus coverage factor covid-19 Database distribution due-to Excel tips Facts incremental markets Measures merchandising new items panel data periods pricing pricing strategy products promoted price quantify opportunity retailer direct data retailer markets shopper data store data Syndicated TDP the basics trade promotion trading areas velocity visualization visualizations volume bridge volume decomposition

Terms of Use | Copyright © 2026 CPG Data Insights · Log in