• Skip to primary navigation
  • Skip to main content
  • Skip to primary sidebar
  • Skip to footer

CPG Data Tip Sheet

Transforming your syndicated data into business insight

  • Home
  • Glossary
  • About Robin Simon
  • About Sally Martin
  • Contact
Blog » Sally Martin » Page 6

Sally Martin

Featured Article

Thank You, Readers on Our 10th Anniversary!...

Robin Simon

Miscellaneous

Featured Article

20 Golden Rules to Help You Shine As An Analyst

Sally Martin

How To Answer Business Questions

Featured Article

Visualization: A Picture Is Worth A Thousand Numbers...

Robin Simon

How To Communicate Insights

Featured Article

Syndicated Retail Sales Data 101...

Sally Martin

How To Get Started with Nielsen/IRI

Velocity: How Well Your Product REALLY Sells

June 24, 2014 By Sally Martin 75 Comments

Velocity questions have dominated the CPG Data Tip Sheet inbox this month, with a number of readers posting comments or writing with questions about this important measure. So we decided it’s time to turn our attention to what is, after all, the third most important measure in your database. Why is velocity the #3 measure? […]

Filed Under: Know Your Measures: Sales Tagged With: velocity

Non Promoted Price Example 1

Why You Should (Almost) Never Look at Non-Promoted Price

May 27, 2014 By Sally Martin 8 Comments

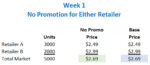
One of the key steps in an IRI/Nielsen pricing analysis is drilling down to look at regular price vs. sale price. Syndicated databases are chock full of price measures and, even for regular price, you still have a choice to make. There are two proxies for regular price: Non-Promoted Price and Base Price.  In this post, […]

Filed Under: Know Your Measures: Pricing and Promotion Tagged With: Non-Promoted Price, Regular Price

Ugly Duckling to Beautiful Swan

Excel VLOOKUP: Transform Your Product Descriptions from Ugly Ducklings to Beautiful Swans

March 3, 2014 By Sally Martin 1 Comment

For many years, I used Excel and never knew about VLOOKUP. Oh, the hours I wasted! I’m writing this post to save you from the same sad, productivity-sapping fate. What is VLOOKUP? It’s a simple Excel function that allows you to pull information from one data set to another, based on some matching value. While […]

Filed Under: How To Communicate Insights Tagged With: Excel tips

CPG Data 911

CPG Data 911: What to Do in an Incremental Volume Emergency

February 1, 2014 By Sally Martin 3 Comments

If you’ve worked with CPG data for a while, you probably know that incremental volume estimates can fluctuate and look a little funky (especially in weeks with little or no trade promotion). I wrote a post about this phenomena a few weeks ago. As I stated then, usually these fluctuations are small relative to total volume […]

Filed Under: How To Answer Business Questions, Know Your Measures: Pricing and Promotion Tagged With: base, incremental

For Aspiring CPG Data Gurus: Incremental Volume Unveiled

December 16, 2013 By Sally Martin 12 Comments

If you are a CPG company with significant trade promotion spending, you probably already buy IRI/Nielsen data or are seriously considering it.   Both IRI and Nielsen measure Incremental Volume: how much extra volume you sold due to trade merchandising. If you’re not sure what incremental volume is, read this first.  If you’ve already got the […]

Filed Under: How To Understand Your Database, Know Your Measures: Pricing and Promotion, Know Your Measures: Sales Tagged With: base, incremental

3 Important Facts About Incremental Volume

December 2, 2013 By Sally Martin 8 Comments

Trade promotion evaluation is a big selling point for Nielsen and IRI data.  Both vendors provide a key piece of the promotion evaluation puzzle: estimates of Incremental Volume.  Incremental Volume tells you how much extra volume you sold due to trade merchandising.  Here are a few things you should know about this important but sometimes […]

Filed Under: How To Understand Your Database, Know Your Measures: Pricing and Promotion, Know Your Measures: Sales Tagged With: base, incremental, trade promotion

  • « Go to Previous Page
  • Page 1
  • Interim pages omitted …
  • Page 4
  • Page 5
  • Page 6
  • Page 7
  • Page 8
  • Interim pages omitted …
  • Page 12
  • Go to Next Page »

Primary Sidebar

Top Posts

  • The 2nd Most Important Measure: % ACV Distribution
  • Velocity: How Well Your Product REALLY Sells
  • Total Distribution Points: Master of All Distribution Measures
  • xAOC and MULO: Multi-Channel Markets in Nielsen & IRI
  • The Beginner’s Guide to Trade Merchandising Measurement

Search CPG Data Tip Sheet

Subscribe to New Posts

Get new posts delivered straight to your inbox. We won't share your email address with anyone.

Thank you for subscribing!

Subscribe

About CPG Data Tip Sheet

We (Sally Martin and Robin Simon) first met in business school and bonded over our interest in geeky marketing stuff. Eventually we both started independent consulting practices. Now we’ve reunited to share with you some of what we’ve learned in our decades of experience working with syndicated CPG data.

Categories

  • Glossary (79)
  • How To Answer Business Questions (42)
  • How To Communicate Insights (17)
  • How To Get Started with Nielsen/IRI (22)
  • How To Understand Your Database (12)
  • Know Your Measures: Distribution (24)
  • Know Your Measures: Pricing and Promotion (45)
  • Know Your Measures: Sales (21)
  • Miscellaneous (6)

Tags

ACV analysis examples analytic skills attributes average items base base weighted weeks career development category management channels characteristics coronavirus coverage factor covid-19 Database distribution due-to Excel tips Facts incremental markets Measures merchandising new items panel data periods pricing pricing strategy products promoted price quantify opportunity retailer direct data retailer markets shopper data store data Syndicated TDP the basics trade promotion trading areas velocity visualization visualizations volume bridge volume decomposition

Footer

Categories

  • Glossary (79)
  • How To Answer Business Questions (42)
  • How To Communicate Insights (17)
  • How To Get Started with Nielsen/IRI (22)
  • How To Understand Your Database (12)
  • Know Your Measures: Distribution (24)
  • Know Your Measures: Pricing and Promotion (45)
  • Know Your Measures: Sales (21)
  • Miscellaneous (6)

Search CPG Data Tip Sheet

Tags

ACV analysis examples analytic skills attributes average items base base weighted weeks career development category management channels characteristics coronavirus coverage factor covid-19 Database distribution due-to Excel tips Facts incremental markets Measures merchandising new items panel data periods pricing pricing strategy products promoted price quantify opportunity retailer direct data retailer markets shopper data store data Syndicated TDP the basics trade promotion trading areas velocity visualization visualizations volume bridge volume decomposition

Terms of Use | Copyright © 2025 CPG Data Insights · Log in