• Skip to primary navigation
  • Skip to main content
  • Skip to primary sidebar
  • Skip to footer

CPG Data Tip Sheet

Transforming your syndicated data into business insight

  • Home
  • Glossary
  • About Robin Simon
  • About Sally Martin
  • Contact
Blog » How To Get Started with Nielsen/IRI » Page 2

How To Get Started with Nielsen/IRI

Featured Article

Thank You, Readers on Our 10th Anniversary!...

Robin Simon

Miscellaneous

Featured Article

20 Golden Rules to Help You Shine As An Analyst

Sally Martin

How To Answer Business Questions

Featured Article

Visualization: A Picture Is Worth A Thousand Numbers...

Robin Simon

How To Communicate Insights

Featured Article

Syndicated Retail Sales Data 101...

Sally Martin

How To Get Started with Nielsen/IRI

Test Your Knowledge: Are You Syndicated Data Literate? (Part 1)

May 25, 2016 By Sally Martin 17 Comments

Print Friendly, PDF & Email

In the CPG industry, syndicated retail sales data from vendors Nielsen, IRI and SPINS is everywhere. Users include retailers, brokers and distributors, direct sales and brand management teams, operations and supply chain forecasters, business journalists, and finance gurus! So if you’re in the CPG industry, you need to be syndicated data literate. Here’s a chance […]

Filed Under: How To Get Started with Nielsen/IRI Tagged With: analytic skills, career development

What’s Your Data Focus? Retail Store Data or Shopper Panel Data?

February 17, 2015 By Sally Martin 6 Comments

Print Friendly, PDF & Email

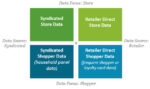
In my last couple of posts, I’ve been talking about the four types of retail sales data, formed by a combination of two parameters: data source (syndicated vs. retailer direct) and data focus (store vs. shopper).  In this post, I’ll discuss data focus in detail, laying out the strengths and weaknesses of each data type […]

Filed Under: How To Get Started with Nielsen/IRI Tagged With: panel data, store data

What’s the Best Data Source? Retailer Direct or Syndicated Nielsen/IRI Data?

October 27, 2014 By Sally Martin 23 Comments

Print Friendly, PDF & Email

A few weeks ago, I wrote about the benefits of retail sales data for CPG manufacturers.  And I summarized the four types of retail sales data which are formed by a combination of two parameters: data source (syndicated vs. retailer direct) and data focus (store vs. shopper).  In this post, I’ll discuss data source in […]

Filed Under: How To Get Started with Nielsen/IRI Tagged With: retailer direct data, Syndicated

Four Types of Retail Sales Data

CPG Fundamentals: What Is Syndicated Retail Sales Data?

September 15, 2014 By Sally Martin 12 Comments

Print Friendly, PDF & Email

CPG Data Tip Sheet focuses on education and best practices for analyzing syndicated retail sales data from IRI and Nielsen (and SPINS for those of you in the Natural/Organic sector). But syndicated data is not the only type of CPG data you’ll encounter. In fact, it’s not even the only type of retail sales data! […]

Filed Under: How To Get Started with Nielsen/IRI Tagged With: panel data, store data, Syndicated, the basics

Trade Promotion Evaluation

The Beginner’s Guide to Trade Merchandising Measurement

September 16, 2013 By Sally Martin 31 Comments

Print Friendly, PDF & Email

Trade promotion evaluation is one of the primary reasons CPG companies buy IRI and Nielsen data. At 10-20% of gross sales, trade funds are a big investment for most manufacturers. And even companies that don’t have direct-to-consumer marketing will still often have retailer driven in-store merchandising. IRI and Nielsen databases can include literally hundreds of […]

Filed Under: How To Get Started with Nielsen/IRI, How To Understand Your Database Tagged With: trade promotion

xAOC and MULO: Multi-Channel Markets in Nielsen & IRI

April 29, 2013 By Robin Simon 38 Comments

Print Friendly, PDF & Email

Are you confused by the terms “xAOC” or “MULO?”  Do you wonder what happened to FDMx?  (Do you even know what FDMx is?)  This post will clear things up for you!   These are the terms that IRI and Nielsen use for  their multi-channel markets.  These markets are designed to provide an estimate of sales across […]

Filed Under: How To Get Started with Nielsen/IRI, How To Understand Your Database Tagged With: FDM, FDMx, markets, markets available, MULO, xAOC

  • « Go to Previous Page
  • Page 1
  • Page 2
  • Page 3
  • Page 4
  • Go to Next Page »

Primary Sidebar

Top Posts

  • The 2nd Most Important Measure: % ACV Distribution
  • Velocity: How Well Your Product REALLY Sells
  • Total Distribution Points: Master of All Distribution Measures
  • xAOC and MULO: Multi-Channel Markets in Nielsen & IRI
  • The Beginner’s Guide to Trade Merchandising Measurement

Search CPG Data Tip Sheet

Subscribe to New Posts

Get new posts delivered straight to your inbox. We won't share your email address with anyone.

Thank you for subscribing!

Subscribe

About CPG Data Tip Sheet

We (Sally Martin and Robin Simon) first met in business school and bonded over our interest in geeky marketing stuff. Eventually we both started independent consulting practices. Now we’ve reunited to share with you some of what we’ve learned in our decades of experience working with syndicated CPG data.

Categories

  • Glossary (79)
  • How To Answer Business Questions (42)
  • How To Communicate Insights (17)
  • How To Get Started with Nielsen/IRI (22)
  • How To Understand Your Database (12)
  • Know Your Measures: Distribution (24)
  • Know Your Measures: Pricing and Promotion (45)
  • Know Your Measures: Sales (21)
  • Miscellaneous (6)

Tags

ACV analysis examples analytic skills attributes average items base base weighted weeks career development category management channels characteristics coronavirus coverage factor covid-19 Database distribution due-to Excel tips Facts incremental markets Measures merchandising new items panel data periods pricing pricing strategy products promoted price quantify opportunity retailer direct data retailer markets shopper data store data Syndicated TDP the basics trade promotion trading areas velocity visualization visualizations volume bridge volume decomposition

Footer

Categories

  • Glossary (79)
  • How To Answer Business Questions (42)
  • How To Communicate Insights (17)
  • How To Get Started with Nielsen/IRI (22)
  • How To Understand Your Database (12)
  • Know Your Measures: Distribution (24)
  • Know Your Measures: Pricing and Promotion (45)
  • Know Your Measures: Sales (21)
  • Miscellaneous (6)

Search CPG Data Tip Sheet

Tags

ACV analysis examples analytic skills attributes average items base base weighted weeks career development category management channels characteristics coronavirus coverage factor covid-19 Database distribution due-to Excel tips Facts incremental markets Measures merchandising new items panel data periods pricing pricing strategy products promoted price quantify opportunity retailer direct data retailer markets shopper data store data Syndicated TDP the basics trade promotion trading areas velocity visualization visualizations volume bridge volume decomposition

Terms of Use | Copyright © 2025 CPG Data Insights · Log in