• Skip to primary navigation
  • Skip to main content
  • Skip to primary sidebar
  • Skip to footer

CPG Data Tip Sheet

Transforming your syndicated data into business insight

  • Home
  • Glossary
  • About Robin Simon
  • About Sally Martin
  • Contact
Featured Article

Thank You, Readers on Our 10th Anniversary!...

Robin Simon

Miscellaneous

Featured Article

20 Golden Rules to Help You Shine As An Analyst

Sally Martin

How To Answer Business Questions

Featured Article

Visualization: A Picture Is Worth A Thousand Numbers...

Robin Simon

How To Communicate Insights

Featured Article

Syndicated Retail Sales Data 101...

Sally Martin

How To Get Started with Nielsen/IRI

How To Estimate Retailer ACV Using Nielsen or IRI Data

July 8, 2013 By Sally Martin 6 Comments

Print Friendly, PDF & Email

Sometimes you want to know total ACV for a retailer (in other words, not just how much they’re selling in your category, but how much they’re selling in the entire store). You need this number to assess trading area trends or to find out whether the retailer is getting their fair share of sales for […]

Filed Under: How To Understand Your Database, Know Your Measures: Sales Tagged With: ACV

Opportunity Gap

Fair Share Gap Analysis: How Much Is That Opportunity Worth?

June 24, 2013 By Sally Martin 12 Comments

Print Friendly, PDF & Email

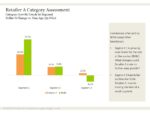
In a recent post, I wrote about the importance of including competitive benchmarks in retailer category assessments. In this post, I’ll build on this concept by showing you how to construct an Opportunity Gap Analysis. This analysis examines whether the retailer is getting its fair share of category sales, compared to competitors. And, more importantly, […]

Filed Under: How To Answer Business Questions Tagged With: category management, retailer markets, trading areas

How Do I Calculate Equivalized (EQ) Sales?

June 10, 2013 By Robin Simon 7 Comments

Print Friendly, PDF & Email

One of our readers in the UK asked the following question after my recent posting on the different sales measures: “How can I calculate equivalized sales?  If there is a formula for that, can you please send it to me?” If you have a custom database, then you probably already have EQ sales as a measure, so you don’t […]

Filed Under: Know Your Measures: Sales Tagged With: EQ, equivalized sales, equivalized units

Business is Good! (Or Is It?): Ways to Measure Sales

May 29, 2013 By Robin Simon 21 Comments

Print Friendly, PDF & Email

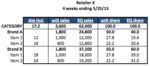
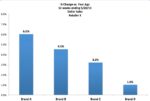
Assume there are 4 brands in your category at Retailer X, with dollar sales growth as shown in the graph below.  Which brand would you say is performing the best?  How about the worst? Since this is not a trick question, Brand A is performing best with dollar sales growing the fastest, at +6% vs. […]

Filed Under: Know Your Measures: Sales Tagged With: business performance, IRI/Nielsen sales measures

Why You Need Competitive Benchmarks in a Category Assessment

May 13, 2013 By Sally Martin 8 Comments

Print Friendly, PDF & Email

Many CPG manufacturers invest in Nielsen and IRI data to create category assessments for individual retailers. These analyses are one component of the category management process. The most compelling and accurate category assessments compare individual retailers against their competitors. And the best benchmark for this comparison is the Nielsen or IRI “remaining market.” The remaining […]

Filed Under: How To Answer Business Questions Tagged With: category management, retailer markets, trading areas

xAOC and MULO: Multi-Channel Markets in Nielsen & IRI

April 29, 2013 By Robin Simon 40 Comments

Print Friendly, PDF & Email

Are you confused by the terms “xAOC” or “MULO?”  Do you wonder what happened to FDMx?  (Do you even know what FDMx is?)  This post will clear things up for you!   These are the terms that IRI and Nielsen use for  their multi-channel markets.  These markets are designed to provide an estimate of sales across […]

Filed Under: How To Get Started with Nielsen/IRI, How To Understand Your Database Tagged With: FDM, FDMx, markets, markets available, MULO, xAOC

  • « Go to Previous Page
  • Page 1
  • Interim pages omitted …
  • Page 14
  • Page 15
  • Page 16
  • Page 17
  • Page 18
  • Interim pages omitted …
  • Page 32
  • Go to Next Page »

Primary Sidebar

Top Posts

  • The 2nd Most Important Measure: % ACV Distribution
  • Velocity: How Well Your Product REALLY Sells
  • Total Distribution Points: Master of All Distribution Measures
  • xAOC and MULO: Multi-Channel Markets in Nielsen & IRI
  • The Beginner’s Guide to Trade Merchandising Measurement

Search CPG Data Tip Sheet

Subscribe to New Posts

Get new posts delivered straight to your inbox. We won't share your email address with anyone.

Thank you for subscribing!

Subscribe

About CPG Data Tip Sheet

We (Sally Martin and Robin Simon) first met in business school and bonded over our interest in geeky marketing stuff. Eventually we both started independent consulting practices. Now we’ve reunited to share with you some of what we’ve learned in our decades of experience working with syndicated CPG data.

Categories

  • Glossary (79)
  • How To Answer Business Questions (42)
  • How To Communicate Insights (17)
  • How To Get Started with Nielsen/IRI (22)
  • How To Understand Your Database (12)
  • Know Your Measures: Distribution (24)
  • Know Your Measures: Pricing and Promotion (45)
  • Know Your Measures: Sales (21)
  • Miscellaneous (6)

Tags

ACV analysis examples analytic skills attributes average items base base weighted weeks career development category management channels characteristics coronavirus coverage factor covid-19 Database distribution due-to Excel tips Facts incremental markets Measures merchandising new items panel data periods pricing pricing strategy products promoted price quantify opportunity retailer direct data retailer markets shopper data store data Syndicated TDP the basics trade promotion trading areas velocity visualization visualizations volume bridge volume decomposition

Footer

Categories

  • Glossary (79)
  • How To Answer Business Questions (42)
  • How To Communicate Insights (17)
  • How To Get Started with Nielsen/IRI (22)
  • How To Understand Your Database (12)
  • Know Your Measures: Distribution (24)
  • Know Your Measures: Pricing and Promotion (45)
  • Know Your Measures: Sales (21)
  • Miscellaneous (6)

Search CPG Data Tip Sheet

Tags

ACV analysis examples analytic skills attributes average items base base weighted weeks career development category management channels characteristics coronavirus coverage factor covid-19 Database distribution due-to Excel tips Facts incremental markets Measures merchandising new items panel data periods pricing pricing strategy products promoted price quantify opportunity retailer direct data retailer markets shopper data store data Syndicated TDP the basics trade promotion trading areas velocity visualization visualizations volume bridge volume decomposition

Terms of Use | Copyright © 2026 CPG Data Insights · Log in