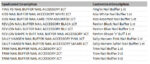
The “syndicatedness” of IRI/Nielsen data is one thing that makes it so powerful. Think about it: IRI and Nielsen capture, label and organize millions of product transactions across hundreds of retailers and then distribute a comprehensive dataset set to thousands of businesses. As a result, everyone can start with the same data, making it easier […]
Syndicated Retail Sales Data 101
We frequently get emails from readers saying “I’m new to Nielsen/IRI/SPINS data. You have so many relevant articles, but where should I start?” In honor of back-to-school season, this post will lay out a route for mastering the basics via posts from this blog. At the very bottom, you’ll find a “reading list” with all […]
What Is (And Isn’t) Measured by Syndicated Retail Sales Data?
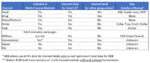
Syndicated store data from Nielsen/IRI/SPINS measures a lot about CPG sales. But not everything! If you are thinking about buying data, it’s important to clearly understand what you will and won’t get out of your purchase. Note that in this article we are talking about store data (from the POS scanner) not household panel data. […]
CPG Syndicated Data Markets: Part 2 – The Nitty-Gritty
Markets are one of the four dimensions that are fundamental to CPG data. I’ve written a two-part series to cover all aspects of the topic. Who should read this post (Part 2)? Anyone interested in the details about how Nielsen/IRI/SPINS cover the following brick & mortar channels: Grocery/Food Mass Merchandise/Walmart Drug Dollar Club Military […]
CPG Syndicated Data Markets: Part 1 – The Big Picture
What Channels Are Available From NielsenIQ and Circana? This is one of our most frequently asked questions! It sounds like a simple one but, as with most things involving syndicated data, the answer is not so simple. In this post, I’ll provide an overview of which types of retailers are available from the FMCG syndicated data […]
Enhancing Your Analysis with TDP, Part 2: Explaining Sales Trends
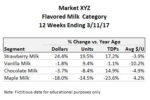
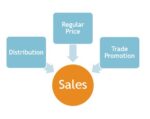
In a recent post, I illustrated the most common usage of Total Points of Distribution (TDP) – as a substitute for % ACV in velocity calculations. In this post, I’ll share another one of my favorite ways to leverage the TDP data metric, which is explaining sales trends. If you aren’t familiar with TDP, read […]