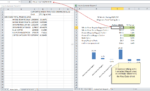
If you define your product category well, you lay the foundation for successful analysis. If you don’t, your analysis can be misleading or useless. Hmm, which is worse? Misleading or useless? What is the “right” way to define a category? Seems like a simple question but, for some products, there’s not a simple answer. Here are […]
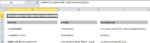
Two Excel Functions That Can Save You Hours of Formatting Time
Did you check out my post about automating reports in Excel? I showed the right way to set up reports (so you won’t have to reformat when you get new data). Now I want to share more about two handy Excel functions: RIGHT and PROPER. I used these for the retailer name, date and […]
How To Automate Monthly Reports (Even If You Aren’t An Excel Wizard)
Nielsen and Circana applications make it easy to create spreadsheet based reports that can be refreshed every month. But in some of their systems, there is minimal formatting, or you may be using they data in a way the leads you to export information and format it outside the Nielsen/Circana application. Luckily, you can easily […]
Big $ Question: Syndicated Database or Custom Database?
Every company and every analyst wants to looks at their retail data a little differently. And Nielsen and IRI are both happy to deliver customized views of their information (for a price). This is the option chosen by most large CPG companies: a custom database. But to provide a cost effective option, Nielsen and IRI […]
The 4 Key Dimensions In Every Nielsen/IRI Database
Does it seem nerdy to worry about data structure when your goal is business insight? It’s not (I promise). Understanding the nitty gritty of your IRI or Nielsen data will ensure you buy the right information and interpret it correctly. The 4 Dimensions are the grammar of the scanner data language. They impact the price […]
Basis Points
Basis Points (bps) is a term sometimes used to represent percentage point changes. It’s usually seen in finance rather than marketing contexts. It historically referred to changes in interest rates but you’ll sometimes see analyst reports using it when referring to share point changes or, really, any metric that involves a percent change. 1 basis […]