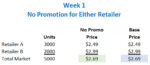

One of the key steps in an IRI/Nielsen pricing analysis is drilling down to look at regular price vs. sale price. Syndicated databases are chock full of price measures and, even for regular price, you still have a choice to make. There are two proxies for regular price: Non-Promoted Price and Base Price. In this post, […]
Q. What’s your retail price? A. It depends!
According to the dictionary, the price of something is “the sum or amount of money or its equivalent for which anything is bought, sold, or offered for sale.” Pricing is one of the “4 Ps” of marketing that we learned about in school (along with Product, Placement/Distribution and Promotion) and is often a key driver […]
The Case of the Mismatched Volume: Comparing Shipments and Retail Sales
A common question that arises, especially when your company is new to syndicated retail sales scanner data, is “how come IRI/Nielsen sales data is different than our own shipment data?” This probably comes up most often in the context of forecasting, when you are trying to determine if you are going to “make the numbers” […]
Product Attributes: The Key to Meaningful Analysis
A product’s attributes are what makes it distinct from other products. Attributes include things like size, color, flavor, package type and other features that are relevant to the category. From a consumer perspective, these attributes are what determine the consideration set and influence the ultimate purchase decision. From a retail perspective, product attributes help define […]
Excel VLOOKUP: Transform Your Product Descriptions from Ugly Ducklings to Beautiful Swans
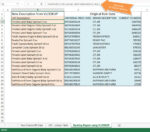
For many years, I used Excel and never knew about VLOOKUP. Oh, the hours I wasted! I’m writing this post to save you from the same sad, productivity-sapping fate. What is VLOOKUP? It’s a simple Excel function that allows you to pull information from one data set to another, based on some matching value. While […]
Picture This: Time After Time, The Line Chart
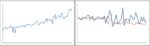
One of the most powerful graphs is the line chart. Line charts allow you to: Decode underlying trends over time Compare trends for different products or markets Explore relationships between different measures In addition to making it easier to see trends, you will typically use a line graph because there’s just too much data to […]