
What Channels Are Available From NielsenIQ and Circana? This is one of our most frequently asked questions! It sounds like a simple one but, as with most things involving syndicated data, the answer is not so simple. In this post, I’ll provide an overview of which types of retailers are available from the FMCG syndicated data […]
How to Calculate A Coverage Factor
This is a follow up to this previous post that dealt with why you need to be very careful when comparing manufacturer shipments to retail sales (also called consumption or takeaway or POS data). Once you are sure that 1. periods are aligned properly, 2. geography and product definitions are as close as possible and 3. […]
What’s With All These Similar Distribution Measures?? (Max, Reach, Average Weekly, etc.)
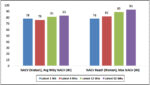
We’ve had several questions over the last few months regarding some facts that people are starting to notice are available in their Nielsen, IRI and/or SPINS databases. The names are very similar, but it’s not obvious how the measures are different or when you’d want to use one or the other. (With apologies to Homer […]
Base Weighted Weeks (Part 2 of 2): What Will Happen to Sales If…
We’re delighted to once again have Mark Laceky, President of mLogic Consulting as guest blogger. mLogic’s previous post explained one of their favorite measures, Base Weighted Weeks (BWW). This follow-up post gives a concrete example of how to use BWW and includes an Excel-based tool that you can download and use yourself. Keep in mind that this […]
Base Weighted Weeks (Part 1 of 2): How Much Trade Promotion Support Are You Really Getting?
We’re delighted to have guest contributors Mark Laceky (President) and Mike Fridholm (SVP, Client Service) from mLogic Consulting introducing one of their favorite measures. Keep in mind that this article is most relevant for use in more strategic planning and analysis, not necessarily for new users or with retailers. Their contact details can be found at […]
Enhancing Your Analysis with TDP, Part 2: Explaining Sales Trends
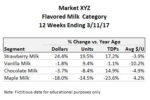
In a recent post, I illustrated the most common usage of Total Points of Distribution (TDP) – as a substitute for % ACV in velocity calculations. In this post, I’ll share another one of my favorite ways to leverage the TDP data metric, which is explaining sales trends. If you aren’t familiar with TDP, read […]