
In these uncertain times, you’re probably asking (or being asked) questions like: What will the business look like for the rest of the year? Will it get back to normal and, if so, when? Will there be a “new normal” and what will that look like? Of course, there is no one right answer to […]

20 Golden Rules to Help You Shine As An Analyst
I was recently purging some old files. I found a long-buried gem, from my IRI days, that I want to share with you. These words of wisdom came from my all-star manager, Linda Abraham. Linda went on to co-found Comscore and is now an investor and advisor to tech companies. Note: when Linda crafted her […]
The Case of the Missing Displays or…“I know we have more display activity than that!”
Does Nielsen data say your brand is getting less Display support than you think you are (or that you’re paying for)? This post gives many reasons why that commonly happens. Here is part of an actual email that we received from a reader. See if this sounds familiar: “I am the owner of a regional […]
Who Is Your Shopper? Decoding the Panel Data “Demographic” Report.
Marketers need to paint a picture of their buyers, humanizing them and understanding their preferences. This is not only important for general messaging but also necessary for target marketing. Syndicated household and shopper panel data is an excellent tool for helping to understand consumer characteristics. Not familiar with this panel data? You may want […]
Who’s NOT Selling My Products? or How to Identify Distribution Voids
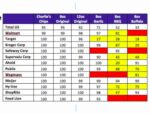
Let’s start with stating the obvious: Shoppers cannot buy your products if they are not available where they shop. Even though your brand may have 12 different items in its product line, not every retailer carries every item. You can identify which retailers sell which items using a relatively straightforward data pull from IRI or […]
How to Be Convincing: Three Rules for Creating Persuasive Charts
We analysts love nothing better than digging through piles of data. But, when it comes to communicating our insights, less is more. Note: In this article, I focus on charts in the form of slides but many of my design recommendations would also apply to dashboards or more complex visualizations. To increase the odds of […]